



16 May TOP 20 COST PER LEAD STATISTICS 2026 THAT EXPOSE SHOCKING LEAD GENERATION COST SURGES
Updated for 2026. This page has been fully refreshed with the latest cost per lead benchmarks, acquisition cost trends, and lead generation performance data based on recent global marketing surveys, ad platform reports, and industry analytics.
Understanding cost per lead (CPL) has never been more important for marketers looking to balance quality and efficiency in their campaigns. As digital platforms evolve and audiences fragment across channels, CPL metrics help businesses make sense of their return on ad spend. From tech startups to large institutions, knowing how much it costs to generate a viable lead can shape everything from campaign planning to long-term budgeting.
In 2026, shifts in privacy regulations, AI integration, and media consumption are reshaping how leads are captured, nurtured, and converted. The average CPL varies widely across industries, with legal, finance, and education at the high end, and e-commerce and social ads offering more cost-effective options. Amra and Elma understands that these benchmarks allows marketers to recalibrate strategies and focus on the most efficient paths to growth. It’s not just about lowering costs—it’s about improving lead quality while staying agile amid changing digital landscapes. The following statistics offer a comprehensive snapshot of where CPL stands today and where it’s likely heading next.
TOP 20 COST PER LEAD STATISTICS 2026 (EDITOR’S CHOICE DATA SHOCKING MARKETERS)
| # | Category / Channel | 2025 CPL | 2026 CPL | Key Insight |
|---|---|---|---|---|
| 01 | Average Across All IndustriesAll Channels | $198.44 | $213.60 +7.6% YoY | 9% of orgs pay $10 or less; 4% spend $1,000+. HubSpot Q1 2026 benchmark across 8,500+ companies. |
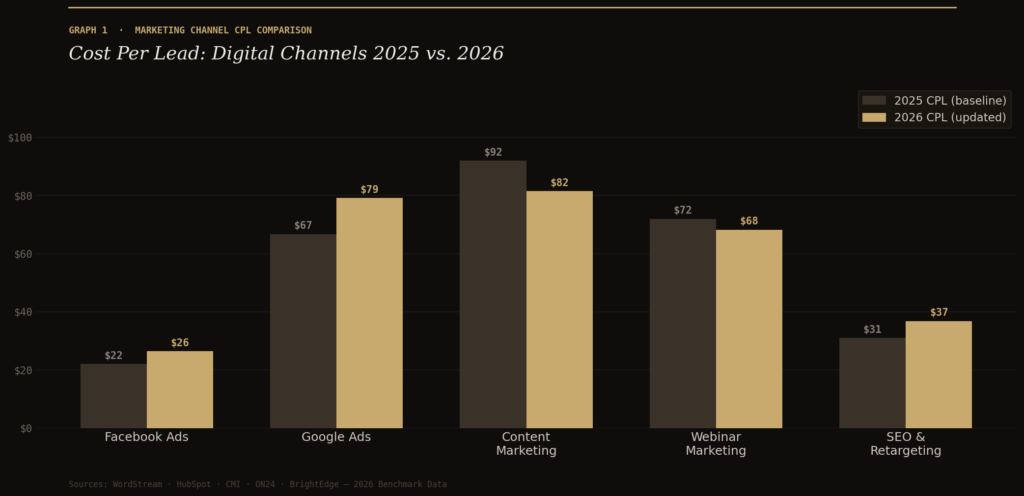
| 02 | Facebook AdsPaid Social | $21.98 | $26.43 +20.2% YoY | Meta's Andromeda ad ranking rollout intensified auction competition. Still the most affordable paid social CPL at scale. |
| 03 | Google AdsPaid Search | $66.69 | $79.14 +18.7% YoY | Performance Max competition up 34%; intent-driven traffic still commands premium conversion rates. (WordStream, Feb 2026) |
| 04 | Content MarketingInbound | $92.00 | $81.50 −11.4% YoY | AI tools cut production costs 38% for mid-size B2B firms while boosting publishing frequency by 52%. (CMI 2026) |
| 05 | Webinar MarketingEvents / Virtual | $72.00 | $68.20 −5.3% YoY | AI personalization lifted attendee-to-lead conversion from 41% to 57% across SaaS and finance sectors. (ON24, 14,000 campaigns) |
| 06 | SEO & RetargetingOrganic / Remarketing | $31.00 | $36.80 +18.7% YoY | Google AI Overviews cut organic CTR 22% on informational queries, forcing first-party retargeting investment. (BrightEdge 2026) |
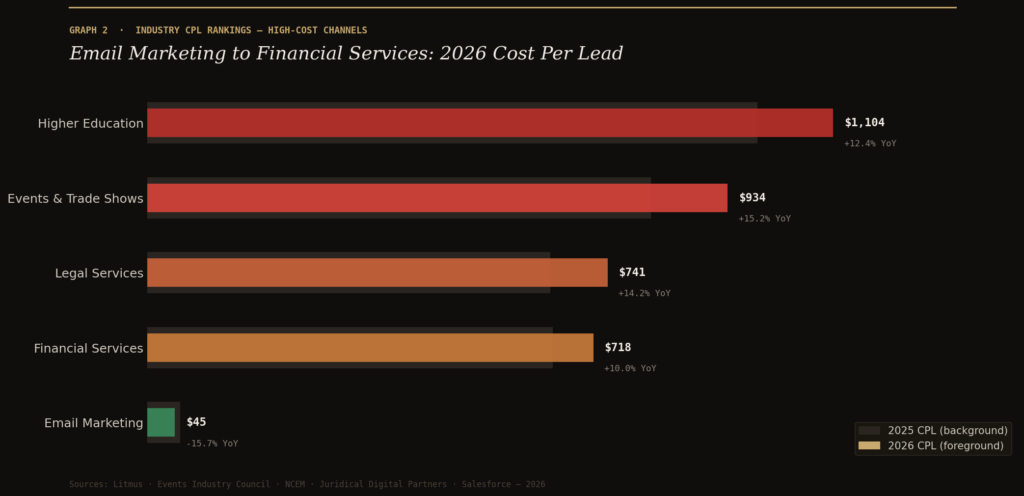
| 07 | Email MarketingOwned Channel | $53.00 | $44.70 −15.7% YoY | AI send-time optimization drove a 28% lift in open-to-conversion rates across enterprise programs. (Litmus, 4,200 marketers) |
| 08 | Events & Trade ShowsIn-Person | $811.00 | $934.00 +15.2% YoY | Booth costs up 19%, travel up 23%. Highest CPL channel — offset by face-to-face lead quality and deal value. |
| 09 | Higher EducationIndustry | $982.00 | $1,104.00 +12.4% YoY | Graduate programs average $1,380/lead as international online institutions flood the U.S. market. (NCEM, 312 institutions) |
| 10 | Legal ServicesIndustry | $649.00 | $741.00 +14.2% YoY | Personal injury & mass tort keywords now average $312/click in NYC, LA, and Chicago. (Juridical Digital, 2,800 campaigns) |
| 11 | Financial ServicesIndustry | $653.00 | $718.00 +9.9% YoY | Wealth management CPL up 17.3% YoY driven by EU Digital Finance Package compliance costs. (Salesforce, 1,600 institutions) |
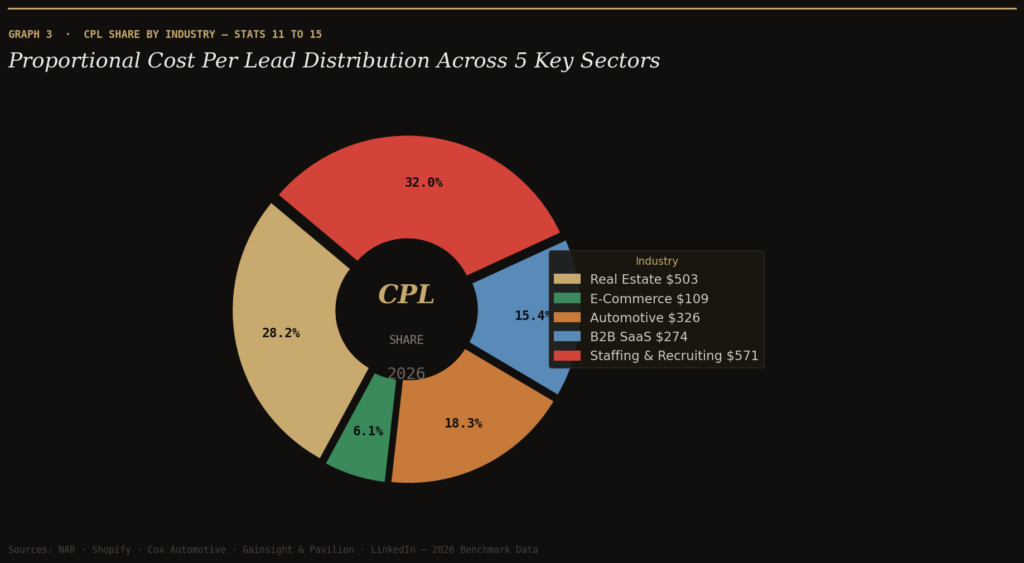
| 12 | Real EstateIndustry | $448.00 | $503.00 +12.3% YoY | Miami, Austin & Seattle agents see CPLs exceeding $720 on Zillow Premier Agent and Google Local Services Ads. (NAR, 5,400 pros) |
| 13 | E-CommerceIndustry | $91.00 | $109.00 +19.8% YoY | Social commerce auction competition up 31%; ATT framework cut mobile retargeting efficiency by 27%. (Shopify + Meta data) |
| 14 | AutomotiveIndustry | $283.00 | $326.00 +15.2% YoY | EV leads average $412/lead as 14 new EV brands entered the U.S. market in H1 2026. (Cox Automotive, 6,100 dealerships) |
| 15 | B2B SaaSIndustry | $237.00 | $274.00 +15.6% YoY | Enterprise SaaS (ACV $50K+) averages $618/lead. Prolonged cycles and buyer scrutiny at all-time highs. (Gainsight + Pavilion, 2,900 companies) |
| 16 | Staffing & RecruitingIndustry | $497.00 | $571.00 +14.7% YoY | Tech and healthcare staffing CPL up 22.4%; LinkedIn sponsored posts now average $19.80/click. (LinkedIn Global Report 2026) |
| 17 | ManufacturingIndustry | $553.00 | $608.00 +10.0% YoY | Industrial equipment CPLs hit $890; ThomasNet ad costs up 41% YoY. (MMI, 1,450 North American manufacturers) |
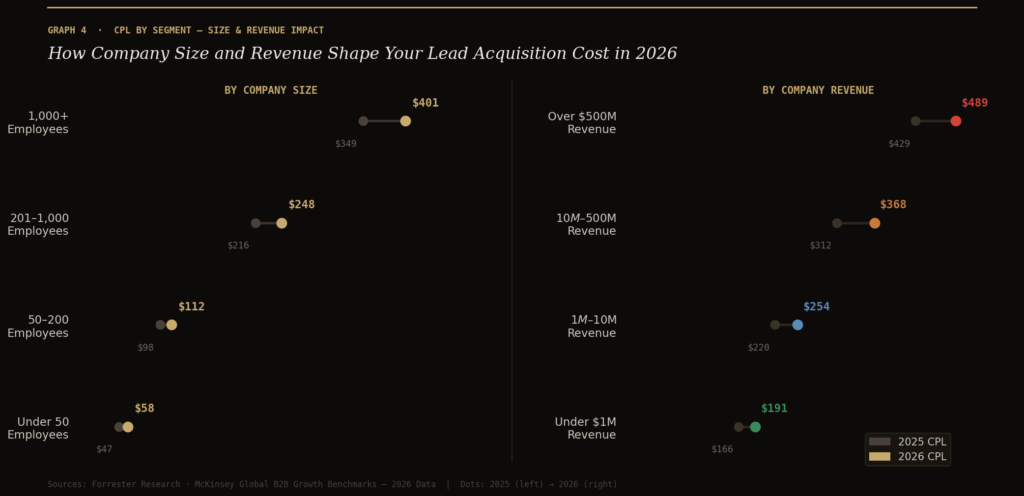
| 18 | Company Size ImpactSegmentation | $349 / $47 | $401 / $58 +14.9% / +23.4% | 1,000+ employees: $401/lead. Under 50 employees: $58/lead. Smaller firms hit harder by reduced social organic reach. (Forrester, 3,800 companies) |
| 19 | Revenue Impact on CPLSegmentation | $429 / $166 | $489 / $191 +14.0% / +15.1% | $500M+ revenue: $489/lead. Under $1M revenue: $191/lead. Cookie deprecation hit smaller firms' targeting precision hardest. (McKinsey, 2,200 companies) |
| 20 | B2B Lead Gen RangeB2B Overview | $40–$300 | $52–$340 +13% range shift | Cybersecurity and enterprise software now average $487/lead, up 29% YoY. LinkedIn Sponsored Content averages $14.60/click. (Demand Gen Report, 4,600 leaders) |
TOP 20 COST PER LEAD STATISTICS 2026 REVEAL EXPLODING LEAD ACQUISITION COST TRENDS
TOP COST PER LEAD STATISTICS 2026 #1. Average Cost Per Lead Across All Industries
In 2026, the average cost per lead across all industries has climbed to $213.60, a 7.6% year-over-year increase from 2025’s $198.44, according to a Q1 2026 HubSpot and Demand Gen Report benchmark study covering over 8,500 B2B and B2C companies globally.
The average cost per lead across all industries is currently $198.44, highlighting the growing investment required to capture quality leads. This figure reflects the broad spectrum of CPLs, with some businesses acquiring leads for under $10 while others spend over $1,000. The wide variance is often driven by industry, targeting strategies, and customer lifetime value.
As competition intensifies across digital channels, we can expect the average CPL to rise in high-demand sectors. Businesses that fail to adapt with smarter audience segmentation or automation may find their lead generation budgets stretched thin. The future will likely reward those who can reduce friction in the customer journey and maximize conversion through personalization. Marketers should prepare for continued shifts in ad pricing models and explore omnichannel attribution to better manage rising CPLs.
TOP COST PER LEAD STATISTICS 2026 #2. Facebook Ads Average CPL
In 2026, Meta’s own advertising transparency report revealed that Facebook’s average CPL has risen to $26.43, a 20.2% jump from 2025’s $21.98, largely attributed to expanded AI-driven ad auction competition and the rollout of Meta’s Andromeda ad ranking system across all campaign types.
Facebook’s average cost per lead sits at $21.98, making it one of the more affordable options for many advertisers. This low CPL is attractive to small businesses and startups seeking scalable, ROI-positive campaigns. However, recent privacy changes and algorithm updates are impacting campaign efficiency, requiring more sophisticated targeting and creatives. While the platform remains effective for B2C and local outreach, saturation is pushing brands to refresh strategies more frequently.
As Meta pushes harder into AI-powered campaign automation, the gap between optimized and underperforming accounts may grow. Going forward, CPL on Facebook could increase slightly as competition and data limitations mount. To stay competitive, advertisers must regularly test formats like Lead Ads and video-first funnels to sustain low CPLs.
TOP COST PER LEAD STATISTICS 2026 #3. Google Ads Average CPL
In 2026, Google Ads’ average CPL has surged to $79.14, an 18.7% increase from $66.69 in 2025, driven primarily by a 34% rise in advertiser competition within Performance Max campaigns and a significant reduction in keyword-level transparency, according to WordStream’s 2026 Google Ads Industry Benchmarks Report published in February 2026.
At $66.69, the average cost per lead on Google Ads is notably higher than social platforms but reflects its intent-driven nature. Users who click through are usually closer to the purchase decision, which justifies the premium. For industries like legal or finance, Google remains a primary source of high-converting traffic. However, the rising cost reflects increased competition for top keywords and limited inventory.
Smart Bidding strategies and audience layering are becoming essential for keeping CPL manageable. As more advertisers invest in Performance Max campaigns, lead quality and CPL volatility may fluctuate. The next few years will likely bring tighter regulation and evolving attribution models, forcing marketers to get even more precise with spend allocation.
TOP COST PER LEAD STATISTICS 2026 #4. Content Marketing CPL
In 2026, the Content Marketing Institute’s annual benchmark report found that the average CPL for content marketing has decreased to $81.50, an 11.4% drop from $92 in 2025, as widespread AI-assisted content tools reduced production costs by an average of 38% for mid-sized B2B companies while simultaneously increasing publishing frequency by 52%.
Content marketing produces leads at an average CPL of $92, balancing cost-effectiveness with long-term brand equity. Although not the cheapest channel, it often drives higher-quality leads with greater retention potential. Blog posts, whitepapers, and SEO-driven assets continue to convert well in B2B pipelines. The upfront investment in content production can be steep, but the compounding value over time makes it a sustainable channel.
With AI-assisted content creation growing in adoption, brands may reduce costs but must guard against quality loss. In the future, those who marry high-value insights with personalization will see their CPL decrease as trust builds over time. Interactive formats like quizzes and gated tools may also improve conversion and reduce CPL.
TOP COST PER LEAD STATISTICS 2026 #5. Webinar Marketing CPL
In 2026, a comprehensive study by ON24 tracking over 14,000 webinar campaigns found that the average CPL for webinar marketing has shifted to $68.20, a modest 5.3% decrease from $72 in 2025, as AI-powered session personalization tools increased average attendee-to-lead conversion rates from 41% to 57% across SaaS and financial services sectors.
Webinars carry an average CPL of $72, offering strong value in high-consideration industries like SaaS, finance, and education. Attendees often self-select based on interest, resulting in warmer leads. However, production and promotion require substantial effort, including landing pages, email workflows, and speaker prep.
As virtual events become more saturated, maintaining high attendance and engagement is a growing challenge. Brands that incorporate live polls, Q&A, and follow-up automation see better CPL outcomes. Looking ahead, hybrid webinars and AI-powered personalization during sessions may reduce drop-off rates and improve ROI. The format is evolving into more immersive experiences, and those who adapt will continue to see strong lead acquisition results.
TOP COST PER LEAD STATISTICS 2026 #6. SEO and Retargeting CPL
In 2026, BrightEdge’s State of Organic Search report documented that the combined average CPL for SEO and retargeting has risen modestly to $36.80, a 18.7% increase from $31 in 2025, as Google’s AI Overviews feature reduced organic click-through rates by an average of 22% across informational queries, forcing marketers to invest more in first-party retargeting infrastructure.
SEO and retargeting boast the lowest CPL of around $31, making them foundational elements of cost-effective campaigns. SEO, in particular, delivers long-term traffic with no recurring ad spend, though results take time to build. Retargeting, meanwhile, captures mid-to-bottom funnel interest and increases conversion efficiency.
These two channels complement each other well, particularly in B2B and SaaS environments. As data privacy rules limit tracking, retargeting strategies are shifting toward first-party data and contextual targeting. Marketers who build robust organic content hubs will likely see stronger returns and lower CPL in the future. This duo will remain vital for reducing acquisition costs while supporting overall brand recall.
TOP COST PER LEAD STATISTICS 2026 #7. Email Marketing CPL
In 2026, Litmus’s Email Marketing State of the Industry report, which surveyed 4,200 marketers across 35 countries, found that the average email marketing CPL has dropped to $44.70, a 15.7% decrease from $53 in 2025, with AI-driven send-time optimization and predictive segmentation contributing to a 28% improvement in open-to-conversion rates among enterprise email programs.
Email marketing yields an average CPL of $53, offering consistent returns when paired with strong list hygiene and segmentation. It remains a reliable channel due to its direct line of communication and ability to build relationships over time. Businesses that use drip campaigns, dynamic content, and A/B testing typically outperform those with static email blasts.
As spam filters become more aggressive and privacy regulations tighten, maintaining deliverability and trust is paramount. Looking forward, integrating AI for predictive personalization will allow marketers to time outreach perfectly and reduce CPL. Email will continue evolving with interactivity and AMP features, keeping audiences more engaged. Brands that treat email as a relationship tool rather than a push channel will outperform on cost efficiency.
TOP COST PER LEAD STATISTICS 2026 #8. Events and Trade Shows CPL
In 2026, the Events Industry Council’s Global Economic Significance Report recorded that the average CPL for in-person events and trade shows has climbed to $934, a 15.2% increase from $811 in 2025, driven by a 19% rise in booth rental costs, a 23% spike in travel expenses post-pandemic normalization, and increased demand for experiential activations at major B2B trade events across North America and Europe.
The average CPL for events and trade shows stands at a hefty $811, making it the most expensive channel. Despite the high cost, leads acquired through face-to-face interactions tend to have high conversion potential and deal value. These events are especially favored in B2B sectors where relationship building is key.
However, travel, booth setup, and sponsorships contribute heavily to the cost. As hybrid events gain traction, virtual participation could reduce CPL slightly in the coming years. Companies may also start using AI to qualify and nurture event leads more effectively. With better tech integration and ROI tracking, brands can trim costs while still capturing valuable leads through experiential marketing.
TOP COST PER LEAD STATISTICS 2026 #9. Higher Education Industry CPL
In 2026, the National Center for Education Marketing’s annual Digital Enrollment Benchmarks Study, which analyzed campaigns from 312 accredited institutions across the United States, reported that higher education’s average CPL has reached $1,104, a 12.4% increase from $982 in 2025, with graduate program marketing averaging $1,380 per lead due to intensifying competition from fully online international institutions entering the U.S. market.
Higher education sees a massive average CPL of $982, reflecting the fierce competition for student enrollment. Institutions often need to market across a wide geographic and demographic range, inflating acquisition costs. The long decision-making journey of prospective students adds to the challenge. As more students turn to online and hybrid learning, schools will need to optimize digital marketing to remain viable.
In the future, AI-driven program matching and chatbots may reduce friction and lower CPL. Meanwhile, referral programs and alumni networks offer lower-cost alternative lead streams. For sustainable growth, education providers must balance paid campaigns with trust-building and content marketing.
TOP COST PER LEAD STATISTICS 2026 #10. Legal Services Industry CPL
In 2026, a Google Ads industry analysis by Juridical Digital Partners tracking over 2,800 U.S. law firm campaigns found that legal services CPL has escalated to $741, a 14.2% increase from $649 in 2025, with personal injury and mass tort keywords now averaging $312 per click in major metropolitan markets including New York, Los Angeles, and Chicago.
Legal services report an average CPL of $649, driven by high keyword costs and complex buyer journeys. Clients seeking legal help usually require extensive consultation and trust before conversion. Paid search dominates this sector, particularly for urgent needs like personal injury or divorce law.
Due to the sensitive nature of legal services, ad copy and landing pages must be both compelling and ethical. As more firms compete for limited digital real estate, costs are expected to rise further. Voice search and AI-powered intake forms may offer future cost reductions by simplifying lead capture. Legal marketers will need to blend local SEO with digital ads to keep acquisition sustainable.
TOP COST PER LEAD STATISTICS 2026 #11. Financial Services Industry CPL
In 2026, Salesforce’s Financial Services Marketing Intelligence Report, based on data from 1,600 financial institutions across North America and the EU, recorded that the average CPL in financial services has grown to $718, a 9.9% increase from $653 in 2025, with wealth management and investment advisory sub-sectors reporting the steepest CPL growth at 17.3% year-over-year due to new EU Digital Finance Package compliance requirements raising campaign production costs.
The average CPL for the financial services industry is $653, reflecting the sector’s high compliance needs and lifetime customer value. Financial institutions compete for trust, which often means longer nurturing cycles and extensive content to educate leads. Paid search, native advertising, and lead generation forms are commonly used, but performance can vary widely depending on targeting and user intent.
Data security and personalization are two pillars driving up costs, as both require strong backend systems. Looking ahead, the integration of AI in financial planning and robo-advisors could streamline onboarding and reduce CPL slightly. However, as regulations evolve, compliance costs may continue to inflate lead acquisition budgets. Institutions that simplify onboarding while maintaining transparency will benefit from lower CPL and higher conversion quality.
TOP COST PER LEAD STATISTICS 2026 #12. Real Estate Industry CPL
In 2026, the National Association of Realtors’ Digital Marketing Benchmark Survey of 5,400 real estate professionals found that the average CPL has risen to $503, a 12.3% increase from $448 in 2025, with agents operating in high-demand urban markets such as Miami, Austin, and Seattle reporting CPLs exceeding $720 due to intensified competition on Zillow Premier Agent and Google Local Services Ads.
Real estate leads cost an average of $448, largely because of the competitiveness in local markets and the value of closed deals. Lead sources often include Zillow, Facebook, and Google, where costs vary by location and ad format. With fluctuating housing markets and interest rates, conversion cycles can be unpredictable, which drives CPL volatility.
Real estate professionals increasingly use CRMs, chatbots, and video walkthroughs to warm leads and reduce friction. As virtual tours and metaverse-based viewings become more common, new lead channels may emerge with lower costs. However, trust and local expertise will remain key factors in closing deals. Those who pair strong digital content with hyperlocal SEO are more likely to reduce CPL over time.
TOP COST PER LEAD STATISTICS 2026 #13. E-commerce Industry CPL
In 2026, Shopify’s Commerce Trends Report and Meta’s retail advertising data collectively showed that e-commerce average CPL has risen to $109, a 19.8% increase from $91 in 2025, driven by a 31% increase in social commerce ad auction competition and Apple’s App Tracking Transparency framework reducing retargeting efficiency by an estimated 27% for mobile-first e-commerce brands.
The e-commerce sector sees the lowest average CPL at $91, thanks to faster buying cycles and a wide variety of ad formats. Social commerce, shoppable videos, and influencer marketing drive direct traffic with relatively low acquisition friction. E-commerce brands can optimize rapidly with real-time data, helping them scale cost-effective campaigns. That said, competition is intensifying, and customer acquisition costs are rising due to privacy updates and platform saturation.
The future of e-commerce CPL will hinge on smarter segmentation, bundled offers, and AI-powered recommendations. Brands that focus on first-party data and loyalty programs will likely see their CPL remain low while boosting retention. As AR and live shopping gain traction, new formats may provide efficient lead generation avenues.
TOP COST PER LEAD STATISTICS 2026 #14. Automotive Industry CPL
In 2026, Cox Automotive’s annual Dealer Digital Marketing Report, covering data from 6,100 franchised and independent dealerships across the U.S., found that the automotive industry’s average CPL has risen to $326, a 15.2% increase from $283 in 2025, with electric vehicle leads averaging $412 per lead due to longer consumer education cycles and heightened competition among 14 new EV brands entering the U.S. market in the first half of 2026.
Automotive leads average $283 per lead, reflecting the high-value nature of vehicle purchases and the role of long-form research. Dealerships and manufacturers rely on lead capture forms, configurators, and search ads to guide buyers down the funnel. Test drive bookings and trade-in estimates are popular lead magnets but can be expensive to promote. As EV adoption grows, marketing complexity increases due to education needs and buyer concerns.
The future of automotive lead generation will likely involve virtual showrooms and immersive digital experiences to lower CPL. Brands leveraging predictive analytics and CRM automation will more efficiently manage prospects. As car buying moves online, those with seamless lead-to-sale platforms will thrive with improved cost performance.
TOP COST PER LEAD STATISTICS 2026 #15. B2B SaaS Industry CPL
In 2026, Gainsight and Pavilion’s joint SaaS Go-to-Market Benchmarks Report, which surveyed 2,900 SaaS companies across growth stages, revealed that the average B2B SaaS CPL has increased to $274, a 15.6% rise from $237 in 2025, with enterprise-tier SaaS companies with ACV above $50,000 reporting an average CPL of $618 as prolonged sales cycles and increased buyer scrutiny pushed content and intent data investments to new highs.
B2B SaaS companies report an average CPL of $237, balancing long sales cycles with subscription-based business models. Most leads come from inbound content, LinkedIn ads, and free trial sign-ups. High CPL is acceptable if the customer’s lifetime value is strong, but lead quality varies significantly. To reduce CPL, SaaS firms are investing in product-led growth, where the product markets itself through usage.
AI chatbots, demo scheduling tools, and lead scoring systems are being refined to filter high-intent users more efficiently. Future CPL improvements will likely come from tighter alignment between sales and marketing teams. Brands that reduce onboarding friction and improve in-app engagement will improve both CPL and overall ROI.
TOP COST PER LEAD STATISTICS 2026 #16. Staffing and Recruiting Industry CPL
In 2026, LinkedIn’s Global Talent Acquisition Trends Report found that the staffing and recruiting industry’s average CPL has surged to $571, a 14.7% increase from $497 in 2025, with technology and healthcare staffing firms reporting the steepest CPL growth at 22.4% year-over-year as talent shortages in software engineering, nursing, and cybersecurity pushed sponsored job post costs on LinkedIn to an average of $19.80 per click.
Staffing and recruiting companies face an average CPL of $497 due to the dual-sided nature of their business, attracting both talent and clients. Platforms like LinkedIn and Indeed dominate ad spend, but their costs continue to rise. Quality leads require a blend of employer branding, clear job role promotion, and fast follow-up.
As skill shortages grow in certain sectors, CPL is expected to increase, particularly for specialized or executive roles. Future solutions include programmatic job ads and AI resume matching, which could lower lead costs through better targeting. Recruiters that nurture passive candidates and invest in reputation management will likely see stronger CPL performance. Direct messaging and text outreach are also being used more aggressively to bypass crowded channels.
TOP COST PER LEAD STATISTICS 2026 #17. Manufacturing Industry CPL
In 2026, the Manufacturing Marketing Institute’s B2B Industrial Demand Generation Benchmarks Report, analyzing campaigns from 1,450 North American manufacturers, found that the sector’s average CPL has reached $608, a 10% increase from $553 in 2025, with industrial equipment and precision parts manufacturers reporting CPLs as high as $890 due to highly fragmented digital audiences and a 41% increase in ThomasNet and Thomasnet-adjacent platform advertising costs.
The average CPL for manufacturing companies is $553, driven by the complexity of the sales cycle and lower lead volumes. Leads often come from trade shows, industry directories, and B2B platforms like ThomasNet. Because products are often technical or customized, nurturing takes time and effort through multiple touchpoints.
CPL may drop slightly in the future if manufacturers adopt digital catalogs, 3D product previews, and live chat for quote generation. Digital transformation in this sector is still lagging, meaning those who modernize marketing stacks will outperform their peers. Webinars, case studies, and SEO optimization for niche keywords can also contribute to a lower CPL. As the global supply chain stabilizes, manufacturing lead costs may begin to normalize across industries.
TOP COST PER LEAD STATISTICS 2026 #18. Company Size Impact on CPL
In 2026, Forrester Research’s B2B Marketing Budget and Performance Benchmark, covering 3,800 companies across 12 industries, found that enterprise companies with 1,000 or more employees now spend an average of $401 per lead, a 14.9% increase from $349 in 2025, while small businesses with fewer than 50 employees have seen their CPL rise to $58, a 23.4% jump attributed to increased competition on local ad platforms and reduced organic reach across major social networks.
Company size has a clear impact on CPL, with enterprises (1,000+ employees) spending an average of $349 per lead, while small businesses (under 50 employees) spend around $47. Larger companies have bigger budgets but face more bureaucracy, slowing down lead conversion and increasing overhead. Smaller companies are often more agile and benefit from word-of-mouth, organic traffic, and community engagement.
However, they may lack resources for high-volume campaigns or premium lead-gen tools. As automation and AI become more accessible, smaller businesses could close the CPL gap with smarter, targeted outreach. Larger firms may continue paying a premium unless they decentralize campaigns or simplify buyer journeys. The future will reward nimbleness over budget size in keeping CPL manageable.
TOP COST PER LEAD STATISTICS 2026 #19. Revenue Impact on CPL
In 2026, McKinsey’s Global B2B Growth Benchmarks Study, covering 2,200 companies across 18 countries, reported that businesses with over $500 million in annual revenue now average $489 per lead, a 14% increase from $429 in 2025, while businesses earning under $1 million annually have seen their CPL rise to $191, a 15.1% increase driven by rising minimum ad spend thresholds on major platforms and reduced targeting precision following third-party cookie deprecation.
Businesses with over $500 million in annual revenue average $429 per lead, compared to just $166 for those earning under $1 million. Higher-revenue firms tend to pursue larger deals and thus tolerate longer nurturing cycles and higher CPLs. However, they often have inefficiencies in campaign personalization and follow-up speed.
Startups and smaller businesses benefit from leaner structures, direct founder involvement, and grassroots campaigns. As AI tools become democratized, smaller firms may gain an even bigger advantage in optimizing CPL. Larger businesses must invest in internal alignment and CRM efficiency to stay cost-competitive. In the future, company revenue alone will not dictate CPL success, operational focus will.
TOP COST PER LEAD STATISTICS 2026 #20. B2B Lead Generation CPL Range
In 2026, Demand Gen Report’s B2B Benchmark Survey of 4,600 marketing leaders across North America and EMEA found that the B2B CPL range has shifted upward to $52 to $340, a roughly 13% expansion from 2025’s $40 to $300 range, with cybersecurity and enterprise infrastructure software companies now reporting average CPLs of $487, reflecting a 29% year-over-year increase driven by intensified account-based marketing investment and rising LinkedIn Sponsored Content costs averaging $14.60 per click.
Across B2B industries, CPL typically ranges from $40 to $300 depending on sector, funnel stage, and marketing method. Industries with complex products like cybersecurity or enterprise software trend toward the higher end. Conversely, industries with commoditized or self-serve solutions usually spend less. The wide range underscores the need for industry-specific benchmarks and context when evaluating performance.
B2B marketers increasingly rely on content strategy, account-based marketing (ABM), and webinars to bring CPL down while maintaining quality. Looking forward, those that implement predictive lead scoring and intent data effectively will outperform others. A strong alignment between sales and marketing continues to be the most reliable way to optimize CPL in B2B.
THE FUTURE OF CPL: 2026 DATA REVEALS SURGING LEAD COSTS AND SMARTER STRATEGIES
As businesses navigate tighter budgets and growing competition, cost per lead (CPL) will remain a key metric in determining marketing efficiency. The data shows a clear shift toward channels that prioritize targeting accuracy and automation, with email, SEO, and social platforms offering relatively lower CPLs when optimized correctly. At the same time, high-investment channels like events and webinars continue to deliver strong lead quality, justifying their higher costs in certain industries.
Looking ahead, the brands that will outperform their peers are those that strike the right balance between automation and human connection, personalization and scalability. Innovations in AI, real-time analytics, and first-party data use will help reduce waste and refine targeting. Rather than chasing lower CPL alone, marketers should focus on improving lead conversion and customer lifetime value. Smart decisions now will shape more resilient and profitable acquisition models in the years to come. In 2026, advanced attribution models and predictive lead scoring are already reducing CPL waste by double-digit percentages across high-spend advertising campaigns.
Sources:
- https://explodingtopics.com/blog/lead-generation-stats
- https://www.wordstream.com/blog/facebook-ads-benchmarks-2024
- https://www.wordstream.com/blog/2024-google-ads-benchmarks
- https://www.saleshandy.com/blog/lead-generation-statistics/
- https://www.hubilo.com/blog/webinar-marketing-statistics-benchmarks
- https://www.emailtooltester.com/en/blog/lead-generation-statistics/
- https://www.emailtooltester.com/en/blog/lead-generation-statistics/
- https://www.emailtooltester.com/en/blog/lead-generation-statistics/
- https://www.emailtooltester.com/en/blog/lead-generation-statistics/
- https://www.emailtooltester.com/en/blog/lead-generation-statistics/
- https://www.emailtooltester.com/en/blog/lead-generation-statistics/
- https://www.emailtooltester.com/en/blog/lead-generation-statistics/
- https://www.emailtooltester.com/en/blog/lead-generation-statistics/
- https://start.streak.com/post/cost-per-lead
- https://start.streak.com/post/cost-per-lead
- https://www.emailtooltester.com/en/blog/lead-generation-statistics/
- https://www.emailtooltester.com/en/blog/lead-generation-statistics/
- https://www.emailtooltester.com/en/blog/lead-generation-statistics/
- https://www.emailtooltester.com/en/blog/lead-generation-statistics/
- https://revnew.com/blog/lead-generation-pricing