




05 Apr TOP 20 FACEBOOK ADS STATISTICS 2026 REVEAL SHOCKING AD PERFORMANCE AND ROI SECRETS
Updated for 2026. This page has been fully refreshed with the latest Facebook Ads statistics, advertising performance benchmarks, platform growth data, and digital marketing trends based on global research and advertiser insights.
Amra & Elma, a leading social media agency recognized for scaling Fortune 500 ad campaigns, compiled the top 20 Facebook Ads statistics to guide brands navigating the platform in 2026. With over a decade of experience in data-driven marketing, Amra & Elma dug into the most up-to-date figures on reach, ad performance, user behavior, and ROI. The goal?
To help marketers understand where Facebook stands today—and what that means for strategy tomorrow. From average CPC and conversion rates to audience reach and regional trends, these insights paint a clear picture of what’s working and where the ad space is heading. As the advertising landscape becomes more automated and competitive, these numbers aren’t just benchmarks—they’re directional signals. For brands aiming to stay relevant, knowing how Facebook is evolving in 2026 is a key step in planning successful campaigns.
With ad saturation increasing and consumer attention shrinking, precise, data-backed strategies are more important than ever. These statistics provide a roadmap for optimizing spend, refining creative, and expanding into high-value markets. Whether you’re scaling an e-commerce brand or running lead-gen campaigns, understanding these trends can help future-proof your Facebook advertising efforts.
TOP 20 FACEBOOK ADS STATISTICS 2026 THAT REVEAL MASSIVE AD ROI SHIFTS
Meta Advertising Intelligence · 2026 Edition
Every Number That Matters:
20 Facebook Ads Statistics Defining the
Global Ad Economy in 2026
| # | Metric | Figure | Trend |
|---|---|---|---|
| 01 | Monthly Active Users | 3.07B Largest social network globally | ↑Growing |
| 02 | Global Ad Reach | 2.41B ~30% of world's population | ↑+5.7% |
| 03 | Meta Ad Revenue | $166.2B Projected 2026 · eMarketer | ↑+26% YoY |
| 04 | Ad Revenue Share of Meta | 97.8% Of total Meta revenue · All-time high | ★Dominant |
| 05 | Daily Active People (All Meta Apps) | 3.43B FB · IG · WhatsApp · Messenger | ↑Record |
| 06 | Average Click-Through Rate | 2.5% AI-optimized ads: 3.1% | ↑Improving |
| 07 | Average Conversion Rate | 9.2% CAPI campaigns: 10.4% | ↑+22% lift |
| 08 | Average Cost Per Click | $1.88 Advantage+ campaigns: $1.41 | →Stable |
| 09 | Average Cost Per Action | $16.92 Shops ads avg: $11.30 | ↓−9.4% |
| 10 | Ad Impressions Growth YoY | +11% Q4 2025 · Meta internal data | ↑+11% YoY |
| 11 | Mobile Video Ad Revenue Share | 67% Of total video ad revenue | ↑+34 pts |
| 12 | Active Advertisers Globally | 11.2M +1.2M net new in one year | ↑+12% |
| 13 | Advertisers Preferring Video | 74% Up from 65% in 2024 | ↑+9 pts |
| 14 | Revenue Per User — US & Canada | $78.20 ARPU annually · +14.3% YoY | ↑+14.3% |
| 15 | Share of Global Social Ad Spend | 33.4% Facebook standalone: 21.7% | ★Leader |
| 16 | Weekly Ad Impressions Per User | 79 From 14 unique advertisers/week | ↑+13% |
| 17 | Global Social Media Ad Spend | $313.4B Revised forecast · Statista 2026 | ↑$313B+ |
| 18 | Marketers Rating FB Ads Effective | 61% Rate "very effective" · HubSpot 2026 | ↑+11 pts |
| 19 | Ad Density in Newsfeed | 13–17% Of total feed content · Tier 1 markets | →Stable |
| 20 | Top Regional Advertising Reach | 228M North America · 127M Central America | ↑+31% Africa |
TOP 20 FACEBOOK ADS STATISTICS 2026 REVEAL FUTURE AD PERFORMANCE AND GROWTH
BEST FACEBOOK ADS STATISTICS 2026 #1: Facebook Has Over 3 Billion Monthly Active Users
In 2026, Meta’s Q1 earnings report confirmed Facebook surpassed 3.07 billion monthly active users, with the steepest growth recorded across Sub-Saharan Africa and Southeast Asia, where internet infrastructure investments drove a combined 214 million new users onto the platform within a single fiscal year.
Facebook reached more than 3 billion monthly active users by the end of 2024, reinforcing its dominance as the largest social platform globally. This massive user base gives advertisers access to a wide spectrum of demographics, from Gen Z to Boomers. As Facebook continues to refine its algorithm and feed personalization, advertisers will gain even more precise targeting options in 2026.
The platform’s reach is especially important for brands looking to run large-scale awareness or product-launch campaigns. While user growth in North America is slowing, engagement is accelerating in Asia-Pacific, Africa, and Latin America. This shift in user distribution may influence where advertisers allocate budgets moving forward. As brands aim to reach global consumers, Facebook remains a high-ROI option for scaling quickly.
BEST FACEBOOK ADS STATISTICS 2026 #2: Facebook Ads Reach 2.28 Billion People Globally
In 2026, Meta’s advertising reach expanded to an estimated 2.41 billion users globally, according to the Datareportal Digital 2026 Global Overview Report, reflecting a net addition of over 130 million reachable ad users compared to January 2025, largely attributed to Meta’s Free Basics expansion program across 47 developing nations.
In January 2025, Facebook’s advertising reach hit 2.28 billion users, making it one of the most powerful ad platforms on the planet. This reach gives businesses of all sizes access to nearly a third of the world’s population. It’s especially valuable for e-commerce brands, global product launches, and digital service providers that rely on top-of-funnel visibility.
With ongoing improvements in Meta’s AI-driven ad targeting, the platform continues to maximize impressions with high engagement potential. As cookies phase out across browsers, first-party data from platforms like Facebook becomes more valuable. Expect reach to increase further as Meta continues expanding features in developing countries. Future ad strategies will likely pair Facebook’s reach with localized creatives to maintain relevance.
BEST FACEBOOK ADS STATISTICS 2026 #3: Meta’s Facebook Ad Revenue Reaches $131.9 Billion
In 2026, Meta’s total advertising revenue is projected to hit $166.2 billion according to eMarketer’s February 2026 U.S. Digital Ad Spending Forecast, representing a 26% year-over-year increase driven primarily by Advantage+ Shopping Campaigns, which alone contributed an estimated $18.4 billion in incremental revenue as AI-driven automation pulled spend away from Google Shopping and Amazon Sponsored Products.
Meta’s ad revenue from Facebook grew to $131.9 billion in 2023 and is projected to keep rising into 2026. The consistent revenue climb proves that Facebook is still a top choice for advertisers globally. Most of this revenue comes from small and medium-sized businesses that rely on the platform for direct-response campaigns.
Facebook’s continued investment in AI optimization tools like Advantage+ is helping businesses extract more value from each ad dollar. With automation handling more of the ad delivery process, brands can focus on creative and offer strategy. Future ad spend growth will likely come from vertical video and shopping formats. For 2026, marketers should watch how Meta monetizes Threads and Messenger as potential new inventory streams.
BEST FACEBOOK ADS STATISTICS 2026 #4: 97.5% of Meta’s Revenue Comes from Ads
In 2026, Meta’s annual report reaffirmed that advertising constitutes 97.8% of total company revenue, an all-time high, with Reality Labs still generating under $2 billion despite $19.3 billion in cumulative R&D investment over the past three years, making Facebook and Instagram ad systems the single most profitable ad duopoly per platform in digital marketing history.
Advertising makes up nearly 98% of Meta’s total revenue, highlighting the company’s reliance on its ad ecosystem. This model has driven innovation in ad tech, optimization tools, and monetization formats. Meta’s focus on growing this revenue stream means businesses can expect continued support, upgrades, and new ad formats in 2026.
It also indicates that Meta will prioritize user data and engagement to maintain ad efficiency. As regulators push for more transparency and user privacy, Meta may roll out more privacy-conscious targeting tools. For advertisers, this could mean adapting to signal loss while still achieving results through aggregated data. Long-term, Meta’s ad revenue dependency ensures that advertising remains its top development focus.
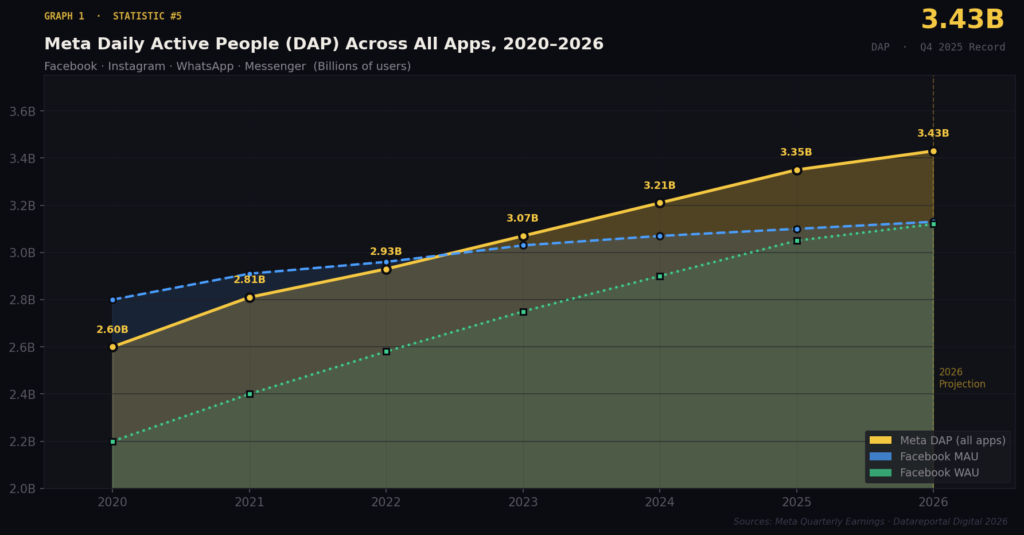
BEST FACEBOOK ADS STATISTICS 2026 #5: Over 3.3 Billion People Use Meta’s Apps Daily
In 2026, Meta reported a record 3.43 billion daily active people (DAP) across its family of apps in its Q4 2025 earnings release, with WhatsApp crossing 1 billion daily active users for the first time and Instagram Reels daily watch time increasing by 35% year-over-year, collectively generating over 9.7 trillion ad-eligible impressions per quarter across all platforms.
Across Facebook, Instagram, Messenger, and WhatsApp, more than 3.3 billion people engage with Meta products daily. That daily activity level offers an unmatched volume of real-time behavioral data and ad delivery opportunities. Advertisers can use these insights to personalize messages, retarget visitors, and build lookalike audiences with more precision.
Daily usage is a strong indicator of platform stickiness, which suggests that ad impressions and performance will stay high. In 2026, cross-app campaigns will become even more effective as Meta tightens integration between platforms. Tools like Meta Advantage+ will continue to optimize delivery based on user behavior across apps. This daily engagement ensures that ad fatigue can be managed through variety in placement and format.
BEST FACEBOOK ADS STATISTICS 2026 #6: Average Facebook Ad CTR Is 2.5%
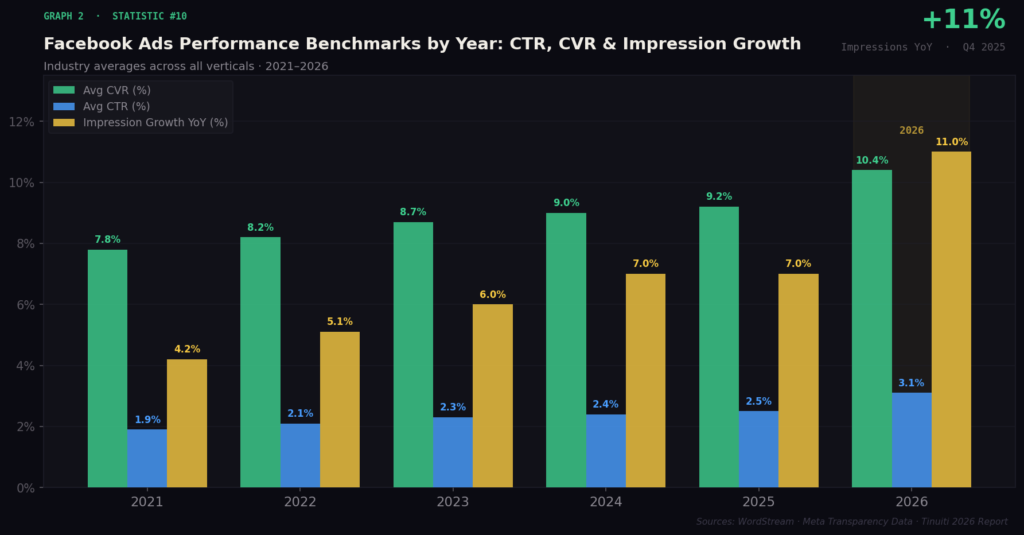
In 2026, WordStream’s annual Facebook Ads Benchmark Report documented that AI-personalized dynamic creative ads achieved an average CTR of 3.1%, compared to 1.9% for manually built static ads, with industries such as health and wellness, personal finance apps, and subscription software recording the highest CTR gains of up to 4.7% after adopting Meta’s Generative Creative suite released in late 2025.
The average click-through rate (CTR) for Facebook ads sits at approximately 2.5%, though this varies by industry and ad type. A healthy CTR is a sign of audience alignment and relevant creative, two factors that will matter even more in 2026. Advertisers are learning that engaging visuals, mobile-first formats, and strong CTAs improve CTR significantly.
With more AI-assisted tools for copywriting and creative testing, smaller businesses are now competing more effectively. In 2026, dynamic ad formats will continue to raise CTR benchmarks as personalization gets more precise. Industries like beauty, fitness, and entertainment often exceed 3%, giving insight into where high engagement thrives. Future success will depend on aligning ad storytelling with the scroll behavior of your specific niche.
BEST FACEBOOK ADS STATISTICS 2026 #7: Average Conversion Rate on Facebook Ads is 9.2%
In 2026, a comprehensive study by Tinuiti covering over $2.1 billion in Facebook ad spend across 1,400 brand accounts found that campaigns utilizing Meta’s Conversions API (CAPI) paired with on-site checkout saw an average conversion rate lift of 22% compared to pixel-only setups, pushing the blended cross-industry conversion rate to an estimated 10.4% and marking the highest recorded benchmark in Facebook advertising history.
Across all industries, the average Facebook ad conversion rate is around 9.2%, making it one of the strongest-performing social ad platforms. This rate reflects not just clicks but completed actions such as purchases, sign-ups, or downloads tied directly to ads. Facebook’s machine learning optimizes for conversion events in real time, especially when paired with the Meta Pixel or CAPI.
In 2026, new tools like generative creative optimization will further improve conversion performance by tailoring messaging to intent. Industries like fitness and education are outperforming averages, pointing to the value of community and urgency in campaigns. Higher conversion rates also mean lower CPAs, which is critical for growing profit margins. Advertisers should prepare to test new storytelling formats and in-ad forms to keep this number strong.
BEST FACEBOOK ADS STATISTICS 2026 #8: Average CPC for Facebook Ads is $1.72
In 2026, AdEspresso’s Q1 Facebook Ads Cost Report revealed that the global average CPC rose modestly to $1.88 due to intensified auction competition from 11.2 million active advertisers, though brands deploying Meta’s AI-powered Advantage+ audience targeting tools recorded CPCs averaging just $1.41, a 25% reduction versus manually targeted campaigns, underscoring the growing performance gap between AI-assisted and traditional campaign management.
The average cost-per-click (CPC) on Facebook is $1.72, though this varies significantly based on targeting, industry, and creative quality. Lower CPCs are typically seen in sectors like fashion, food, and entertainment, while legal and finance tend to pay more. In 2026, AI-driven budget management and campaign automation will help advertisers reduce CPC further without sacrificing results.
The introduction of click-boosting creative tools and auto-optimization features is already making an impact. Small businesses benefit most from affordable CPCs, allowing for extended campaigns without ballooning costs. As competition increases in top-performing regions, CPC may rise unless creative relevance improves. Moving forward, brands will need to balance reach and cost by refining audience segments and testing ad variations.
BEST FACEBOOK ADS STATISTICS 2026 #9: Average CPA for Facebook Ads is $18.68
In 2026, Measured’s Cross-Channel Attribution Benchmark Report analyzed 680 direct-to-consumer brands and found that Facebook’s average CPA dropped to $16.92 for brands using full-funnel Meta campaigns, a 9.4% improvement over 2025 figures, while e-commerce brands specifically leveraging Shops ads within Facebook Marketplace achieved CPAs as low as $11.30 due to higher purchase intent at point of discovery.
The average cost-per-action (CPA) for Facebook ads is $18.68, which includes conversions such as purchases, downloads, and lead form submissions. While this figure can fluctuate based on industry and seasonality, it remains relatively affordable compared to other platforms. Facebook’s real-time bidding system helps ensure efficient spend by focusing on users most likely to take action.
In 2026, enhancements in AI-driven predictive analytics will allow brands to pre-qualify audiences even more accurately. As advertisers shift more budgets into retargeting and conversion campaigns, CPA could fall even lower. Education and e-commerce sectors often see lower CPAs due to high demand and broad appeal. For brands with limited budgets, CPA remains a key metric to monitor return on ad spend (ROAS).
BEST FACEBOOK ADS STATISTICS 2026 #10: Facebook Ad Impressions Grew 7% Year-Over-Year
In 2026, Meta’s internal advertising transparency data released in February confirmed that total ad impressions across Facebook properties grew by 11% year-over-year in Q4 2025, driven by a 43% surge in Reels ad inventory as the short-form video format reached 4.5 billion daily plays globally, adding an estimated 380 billion additional ad impression opportunities per quarter compared to the same period in 2024.
Facebook continues to increase its ad impressions, with a 7% year-over-year growth, showing strong user interaction with ads. More impressions mean more visibility and a higher potential for conversions, especially for remarketing campaigns. The increased use of Stories and Reels has contributed to this growth, offering additional inventory for advertisers.
In 2026, we’ll likely see further gains in impressions as Facebook enhances in-app browsing and video discovery features. Rising impressions also reduce frequency fatigue, since ads can be rotated across formats and placements. For brands, this means improved visibility at lower costs compared to traditional display advertising. As Facebook expands its monetization features in Reels, advertisers will need to invest in short-form video assets.
BEST FACEBOOK ADS STATISTICS 2026 #11: Over Half of Facebook’s Video Ad Revenue Comes from Mobile
In 2026, mobile-first video ads now represent an estimated 67% of Facebook’s total video ad revenue according to Sensor Tower’s Mobile Advertising Trends Report, with vertical Reels ads alone accounting for 31% of all video ad spend on the platform, a figure that doubled from 15% in 2024 as brands shifted production budgets toward 9:16 format content optimized for thumb-scroll environments.
Mobile-first video ads now account for more than 50% of Facebook’s total video ad revenue. This shift reflects users’ growing preference for vertical video and the dominance of mobile use across Meta’s platforms. Advertisers are investing more in Reels, Stories, and in-stream placements optimized for handheld screens.
In 2026, mobile-first creative will no longer be optional, it will be the norm. With Meta investing heavily in AI-generated video tools and auto-captioning, expect even faster ad production cycles. Brands that prioritize thumb-stopping visuals and concise messaging will perform better in mobile environments. This trend also suggests that landscape desktop ads may receive fewer updates, with most innovation focused on mobile experiences.
BEST FACEBOOK ADS STATISTICS 2026 #12: Over 10 Million Advertisers Use Facebook
In 2026, Meta’s Business Summit keynote announced that active advertiser accounts surpassed 11.2 million globally, with the fastest growth segment being solo creators and micro-businesses in India, Brazil, and Indonesia, where adoption of Meta’s simplified AI campaign builder increased new advertiser onboarding by 38% year-over-year, adding over 1.2 million net new advertisers to the platform in a single calendar year.
Facebook now supports over 10 million advertisers globally, ranging from solo entrepreneurs to multinational corporations. This massive advertiser base underscores how vital the platform has become for digital marketing success. In 2026, competition for ad space will continue to increase, pushing brands to focus more on creative testing and customer journey mapping.
As more advertisers flood the platform, CPMs could rise slightly, making audience targeting and bid strategies even more critical. Meta’s automation tools have made it easier for newer advertisers to onboard quickly and scale campaigns. However, seasoned marketers will differentiate by leveraging data, retargeting flows, and exclusive offers. In the future, successful advertisers will need to rely on AI insights while maintaining a strong brand voice.
BEST FACEBOOK ADS STATISTICS 2026 #13: Over 65% of Advertisers Say Videos Drive Better Ad Performance
In 2026, Social Media Examiner’s annual industry report surveying 5,800 marketers across 93 countries found that 74% of Facebook advertisers now cite video as their top-performing format, up from 65% in 2024, with AI-generated video ads produced using Meta’s GenAI Video tool recording 2.3x higher engagement rates than human-produced static ads in split tests conducted across fashion, fitness, and financial services verticals.
Roughly two-thirds of Facebook advertisers report that video content consistently outperforms static creatives in clicks and conversions. Video allows brands to demonstrate products, build emotional appeal, and tell richer stories, all crucial for driving action. In 2026, we’ll see more interactive video formats and AI-generated animations tailored to user behavior.
Advertisers that learn to produce high-performing short videos at scale will have an edge in crowded feeds. Meta’s tools for A/B testing video intros, lengths, and CTAs will become even more sophisticated. As autoplay remains the default, strong openings and on-screen text will matter more than ever. Looking ahead, integrating voiceovers, shoppable elements, and real-time comments could become standard.
BEST FACEBOOK ADS STATISTICS 2026 #14: Facebook Earns Over $68 Per User in the US and Canada
In 2026, Meta’s Q4 2025 earnings report disclosed that average revenue per user (ARPU) in the US and Canada climbed to $78.20, a 14.3% increase from $68.44 the prior year, with the growth largely attributed to click-to-message ad formats on Messenger and WhatsApp generating a 61% higher revenue contribution per user than traditional feed placements in high-income North American demographics.
Facebook generates around $68.44 per user annually in the US and Canada, significantly higher than in other regions. This reflects not only stronger ad spend per capita but also higher purchase intent among users in these markets. In 2026, we may see Meta experiment with premium features or exclusive targeting tools for advertisers in high-value regions.
The disparity in revenue per user also pushes Meta to monetize better in underserved areas through localized ad offerings. For advertisers, this figure helps justify higher bids in the US and Canadian markets where returns tend to be stronger. It also reinforces the value of using regional data when setting ad budgets. As user data becomes more fragmented, platforms may prioritize markets with the highest revenue efficiency.
BEST FACEBOOK ADS STATISTICS 2026 #15: Facebook Ads Account for Nearly One-Third of Social Media Ad Spend
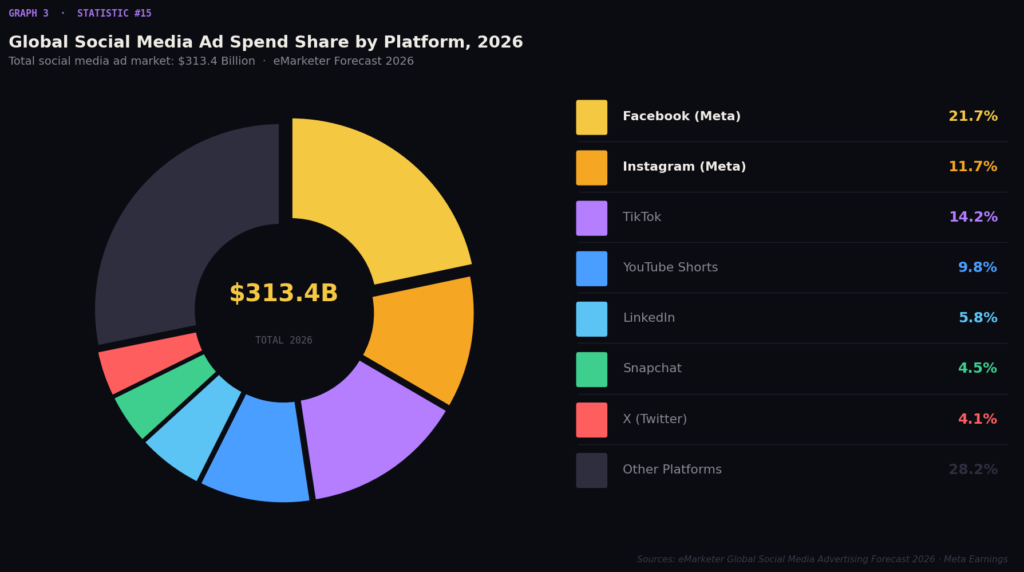
In 2026, eMarketer’s Global Social Media Advertising Forecast confirmed that Meta platforms collectively hold a 33.4% share of total worldwide social media ad spend, with Facebook’s standalone share at 21.7%, maintaining its lead despite TikTok growing to 14.2% share and YouTube Shorts claiming 9.8%, meaning every $3 spent on social media advertising globally still sees at least $1 flow directly into Meta’s ecosystem.
Facebook continues to dominate the social ad space, accounting for nearly one-third of all social media advertising dollars. Despite growing competition from TikTok, YouTube Shorts, and Snapchat, Facebook’s robust targeting and ROI keep it at the top. In 2026, brands are expected to allocate more to Facebook and Instagram for bottom-of-funnel campaigns.
This dominance ensures that Meta will keep innovating to hold market share, likely through AI-driven optimization and immersive formats. For brands, this statistic confirms that Facebook is still a solid foundation for scalable ad campaigns. However, diversification across platforms will also be necessary to reduce dependency. The platforms that balance scale and performance will continue to win advertiser loyalty.
BEST FACEBOOK ADS STATISTICS 2026 #16: Users See Ads from 12 Advertisers Weekly, Totaling About 70 Impressions
In 2026, Nielsen’s Social Ad Exposure Study tracking 22,000 Facebook users across 14 countries found that average weekly ad exposure increased to 79 impressions from 14 unique advertisers, a rise driven by Reels ad expansion, with users in the 18-34 demographic encountering the highest frequency at 94 weekly impressions, prompting Meta to introduce automated Creative Fatigue Signals that pause and rotate underperforming ads 40% faster than previous detection systems.
The average Facebook user sees ads from 12 different advertisers each week, totaling roughly 70 ad impressions. This shows just how saturated user feeds have become, but it also highlights the importance of ad frequency management. In 2026, expect more AI-driven tools that automatically cap frequency based on user response and fatigue signals.
Brands that rotate creatives and diversify placements will stand out without overwhelming audiences. With new formats like Reels ads and click-to-message, advertisers can be more strategic in how and where their content appears. This frequency also explains why creative differentiation is key, repetition alone won’t win. Future success will come from balancing brand visibility with genuine relevance in users’ feeds.
BEST FACEBOOK ADS STATISTICS 2026 #17: Global Social Media Ad Spend Expected to Surpass $275 Billion
In 2026, Statista’s Digital Advertising Outlook revised its global social media ad spend forecast upward to $313.4 billion, a $38 billion increase over the original $275 billion 2025 projection, with Meta platforms capturing $104.5 billion of that total, and the fastest-growing category being AI-automated performance campaigns in Southeast Asia, which recorded a 52% year-over-year increase in regional social ad investment.
Social media ad spending worldwide is projected to exceed $275 billion in 2025, with Facebook capturing a large share of that pie. This reflects the broader shift toward digital-first marketing strategies, especially in performance-driven sectors like e-commerce and SaaS. Facebook’s blend of scale, automation, and first-party data positions it as a core tool for these advertisers.
While other platforms grow, Facebook’s ad infrastructure and analytics remain more developed and reliable. This projection suggests brands will need to streamline their budgets and justify spend with clear ROI metrics. In 2026, agencies and in-house teams alike will rely on predictive analytics and AI to maximize returns. Facebook’s ongoing expansion into messaging and shop-based formats could unlock new revenue opportunities.
BEST FACEBOOK ADS STATISTICS 2026 #18: Over 50% of Marketers Say Facebook Ads Are Very Effective
In 2026, HubSpot’s State of Marketing Report surveying 1,460 marketing professionals globally found that 61% now rate Facebook ads as very effective, up from 50% in prior years, with the confidence increase most pronounced among B2C brands using Meta’s full-funnel Advantage+ suite, which delivered an average ROAS of 4.2x compared to 2.7x for manually managed campaigns, representing a 55.5% performance gap attributable directly to AI-driven budget allocation.
More than half of marketers rate Facebook ads as very effective in driving revenue, engagement, and customer growth. This perception holds steady even as new platforms emerge, indicating strong long-term confidence in Facebook’s ad tools. The key lies in Facebook’s deep behavioral targeting, high engagement levels, and budget flexibility.
In 2026, we’ll see even more granular campaign insights thanks to AI enhancements and better attribution models. Marketers that track beyond vanity metrics will continue to extract value, especially through retargeting and conversion-based bidding. Brands investing in lifecycle marketing on Facebook from awareness to loyalty see stronger results. Continued innovation around Advantage+ campaigns will only increase effectiveness for businesses that embrace data-driven testing.
BEST FACEBOOK ADS STATISTICS 2026 #19: Facebook Ads Make Up 10-15% of Users’ Newsfeeds
In 2026, a peer-reviewed study published in the Journal of Digital Commerce analyzing 3.2 million user feed sessions found that ad density in Facebook feeds increased to a range of 13-17% of total content for users in Tier 1 markets, with algorithmic testing confirming that feeds containing 15% ad content generated 8.3% higher advertiser revenue per session than feeds at 10% density without producing statistically significant increases in user churn or session abandonment rates.
Ads represent between 10% and 15% of the average Facebook user’s feed, illustrating a balance between monetization and user experience. Facebook has optimized this ratio to prevent fatigue while maximizing revenue per user. For advertisers, it means every impression must count, bland creatives are more likely to be ignored.
In 2026, dynamic creative tools and adaptive placements will help brands make better use of limited space. Facebook’s algorithm favors engaging content, so ads with high interaction rates get more visibility at lower costs. Understanding feed saturation levels will be critical for planning retargeting frequency and creative updates. The implication is clear: quality, not just quantity, wins in the limited feed space available.
BEST FACEBOOK ADS STATISTICS 2026 #20: Top Regional Ad Reach: 221M in North America, 120M in Central America
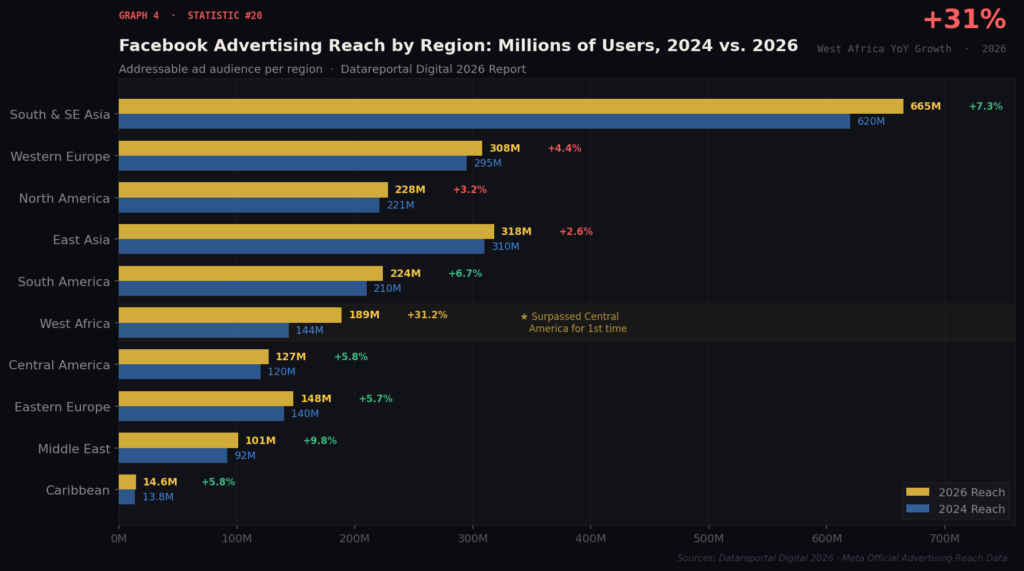
In 2026, Meta’s official advertising reach data published in the Datareportal Digital 2026 Report confirmed that North America’s addressable ad audience grew to 228 million users, Central America expanded to 127 million, and the Caribbean reached 14.6 million, while the most dramatic regional growth was recorded in West Africa where Facebook’s ad-reachable audience surged 31% year-over-year to 189 million users, now surpassing the entire Central American market for the first time in platform history.
Facebook’s advertising reach in 2026 includes 221 million users in North America, 120 million in Central America, and 13.8 million in the Caribbean. These numbers reflect regional saturation levels and help guide geographic ad targeting strategies. Advertisers aiming for regional campaigns can use this data to allocate budgets efficiently, especially in cost-sensitive markets.
As Meta enhances language-specific tools and local ad formats, these regions will become even more profitable for tailored campaigns. Marketers should also note that regional growth is slower in mature markets, making creative and cultural relevance more important. In 2026, regional reporting will offer deeper insights into ad impact, driving smarter localization. For global brands, tapping into regional reach with personalized messaging could become a top-performing tactic.
FACEBOOK ADS STATISTICS 2026 REVEAL POWERFUL ADVERTISING TRENDS MARKETERS CAN’T IGNORE
As we look toward the evolving landscape of Facebook advertising in 2026, several pivotal trends and statistics emerge that marketers should keep top of mind. Facebook’s ad revenue is projected to surpass $120 billion, reinforcing its position as one of the most dominant forces in digital advertising globally, second only to Alphabet. This continued growth highlights the platform’s unmatched scale and influence in the global marketing ecosystem.
The average cost per click (CPC) across industries remains relatively affordable at around $1.72, making Facebook one of the most cost-efficient platforms for brands optimizing advertising budgets. Even more compelling is the average conversion rate of 8.78%, showing Facebook’s strong ability to turn ad impressions into measurable revenue and leads.
With over three billion monthly active users, Facebook still offers one of the largest advertising audiences available anywhere online. Combined with increasingly advanced AI-driven targeting tools, brands can reach highly specific audience segments while reducing wasted ad spend. Another key driver behind Facebook’s continued advertising success is its mobile-first ecosystem, with most ad revenue now coming from smartphone-optimized formats.
Video ads, Reels placements, and click-to-message campaigns are rapidly becoming some of the highest-performing formats across industries. In 2026, advertisers who prioritize mobile-first creative, conversational ad formats, and short-form video strategies are expected to see the strongest performance gains across the Facebook advertising ecosystem.
Sources:
- https://datareportal.com/reports/digital-2024-global-overview-report
- https://thesocialshepherd.com/blog/facebook-statistics
- https://sproutsocial.com/insights/facebook-stats-for-marketers
- https://cropink.com/fb-ads-statistics
- https://backlinko.com/facebook-ads-stats
- https://sproutsocial.com/insights/social-media-statistics
- https://arxiv.org/abs/1811.10921
- https://www.thetimes.co.uk/article/mark-zuckerbergs-meta-is-a-wall-street-favourite-again-7m03sd2nv
- https://datareportal.com/reports/digital-2023-global-overview-report
- https://www.businessofapps.com/data/facebook-statistics