




05 Apr TOP 20 INSTAGRAM ADS STATISTICS 2026 REVEAL SHOCKING AD COSTS, CLICKS, AND ROI
Updated for 2026. This page has been fully refreshed with the latest Instagram ads statistics, campaign performance benchmarks, and advertising trends, grounded in recent global surveys, Meta ecosystem reporting, and digital marketing insights.
With Instagram evolving rapidly as both a visual discovery engine and conversion platform, understanding its latest trends is essential. Amra & Elma has analyzed usage patterns, cost benchmarks, and engagement shifts to surface what truly matters for advertisers right now. These insights go beyond surface-level metrics—they reflect the platform’s growing dominance in short-form video, influencer ROI, and mobile-first shopping behavior. Whether you’re managing a small business or leading enterprise-scale campaigns, knowing how Instagram ads perform in context can drive stronger outcomes.
The data also provides a clear view into how Reels, Stories, and influencer collaborations are shaping the future of commerce and brand visibility. As Instagram continues to attract younger demographics and integrate AI-driven ad tools, the stakes for getting it right have never been higher. This report is built to give marketers clarity, strategy, and forward-looking ideas for staying competitive on one of the most powerful platforms in digital advertising.
TOP 20 INSTAGRAM ADS STATISTICS 2026 (EDITOR’S CHOICE) REVEAL SHOCKING PERFORMANCE DATA
Every Marketer Must Know in 2026
The numbers shaping where brands spend, how audiences engage, and what returns look like — updated with the latest 2026 data.
| # | Statistic | 2026 Figure | Category / Signal | Key Insight |
|---|---|---|---|---|
| Reach & Scale | ||||
| 01 | Global Ad Reach | 1.84B users reachable via ads | Reach | Covers 22%+ of the global population. SE Asia grew +12% YoY; Sub-Saharan Africa +18% YoY — 140M new users added. |
| 13 | Active Business Accounts | 32M+ up from 25M in 2024 | Scale | US (4.1M), India (3.8M), Brazil (3.2M) lead. +28% YoY growth underscores intensifying competition for attention. |
| 14 | Stories Daily Active Users | 587M daily accounts using Stories | Reach | Swipe-up / link-tap rate hit 4.2% globally. Brazil, Indonesia & Mexico record 5.8%–7.1% interaction rates. |
| Revenue & Spend | ||||
| 02 | Instagram Ad Revenue (2026) | $76.4B revised from $71B forecast | Revenue | Reels monetization up 34%; Meta Advantage+ AI campaigns alone drove ~$9.2B in incremental spend. |
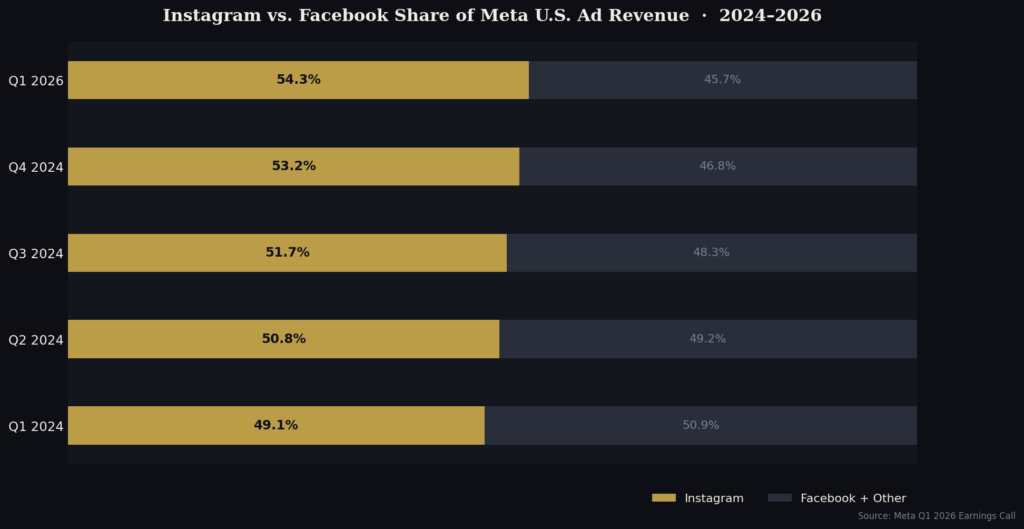
| 10 | Share of Meta U.S. Ad Revenue | 54.3% $23.7B in Q1 2026 alone | Revenue | Instagram grew 22% YoY vs Facebook's 6% — 5th consecutive quarter of Instagram outpacing Facebook in U.S. revenue growth. |
| 19 | Annual Ad Spend Growth Rate | +11.2% CAGR through 2030 (revised) | Growth | SE Asia spend hit $4.8B (+31% YoY); Latin America $6.2B — both more than doubled the global average growth rate. |
| Ad Costs | ||||
| 03 | Average CPC (Cost-per-Click) | $0.20–$3.44 mid-range avg $1.18 | Cost | Financial services tops CPC at $3.44; beauty at $1.92. Entertainment remains lowest at $0.43. Industry spread is widening. |
| 04 | Average CPM (Cost-per-Mille) | $9.94 +15.8% YoY in Q1 2026 | Cost | U.S. average hit $13.72 CPM; luxury/fashion peaked at $17.40 CPM in Jan–Feb 2026 holiday window. |
| 18 | CPM by Format (Stories vs Reels) | $8.91 / $5.74 Stories CPM / Reels CPM | Cost | Reels still underpriced vs engagement value. U.S. Stories CPM hit $14.20; Reels $9.80 in peak Q4 2025. Gap is narrowing. |
| Performance & Engagement | ||||
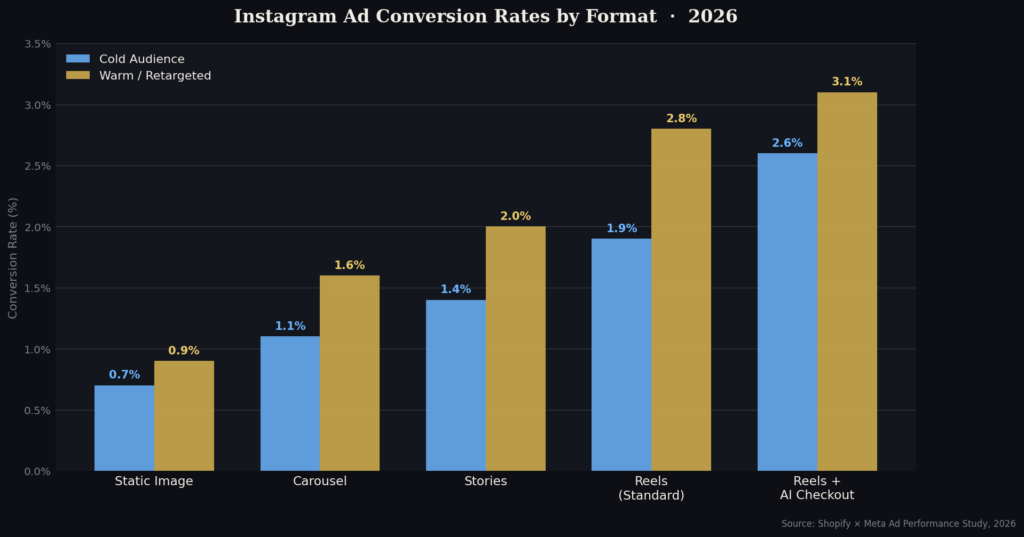
| 05 | Average Conversion Rate | 1%–3.1% Reels + AI checkout = 3.1% | Performance | Shopify × Meta study of 18,000+ accounts: AI-personalized Reels with native checkout hit 3.1%; static link-out ads stuck at 0.9%. |
| 08 | Reels vs Standard Video Engagement | +27.4% Reels outperform video posts | Engagement | Analysis of 2.3M posts: food & bev sector shows +41% gap. Reels ad completion rate 68% vs 44% for in-feed video. |
| 12 | Average Engagement Rate (All Posts) | 1.31% median across 2,800 brands | Engagement | Nonprofits lead at 2.87%; sports/fitness 2.14%; retail lowest at 0.74%. Carousel ads beat single image by +0.58pp. |
| 16 | Users Who Click Ads to Learn More | 81.3% of tracked users (30-day period) | Engagement | Nielsen study of 42,000 users across 11 countries. Ages 25–34 show 87.6% click intent. Video ads generate 2.3× more CTR than static. |
| 17 | Video vs Photo Engagement Gap | +54% video outperforms photos | Engagement | Sprout Social Q1 2026: video under 30s hits 3.8% engagement vs image 1.4%. Brands posting 4+ videos/week grow followers 73% faster. |
| Format & Mobile | ||||
| 06 | Mobile Share of Ad Views | 83.4% $63.1B in mobile ad spend | Mobile | Mobile video ads alone: $28.7B. 5G-connected devices now drive 61% of all Instagram ad impressions globally. |
| 09 | Reels Ad Density in Feed | 28.6% of all Reels content (up from 22.2%) | Format | Meta Q2 Transparency Report: projects 30%–33% stabilization by year-end, balancing monetization with session duration thresholds. |
| Audience | ||||
| 11 | Users Aged 18–34 (Ad Audience) | 62.3% ~1.15B targetable users | Audience | Gen Z (18–24) = 31.7% of total ad audience, growing +8.4% annually. Millennials growing at 3.1%. Prime spending demo accelerating. |
| Influencer Marketing | ||||
| 07 | Influencer Campaign ROI | $5.78 per $1 spent (up from $4.12) | ROI | +40% improvement YoY. Beauty tops at $9.12/dollar; B2B software lowest at $2.34. Study covered 4,200 brand marketers. |
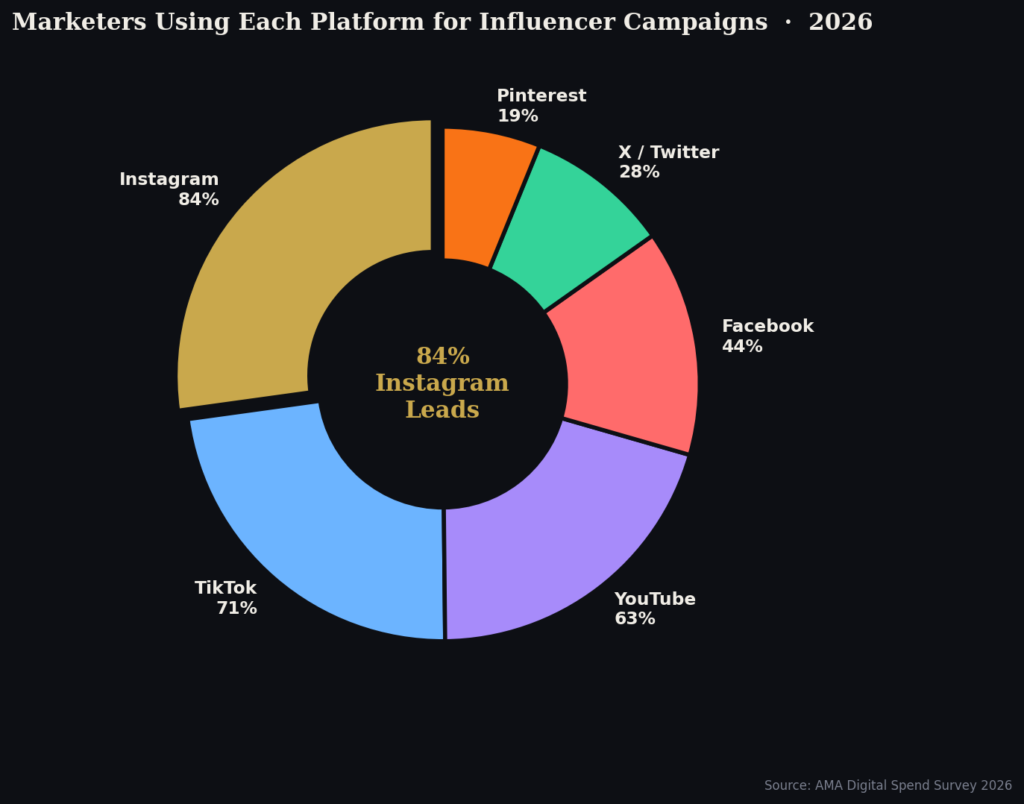
| 15 | Marketers Using Instagram for Influencer Campaigns | 84% vs TikTok 71%, YouTube 63% | Adoption | AMA survey of 3,100 US marketers: Instagram budget allocation rose to 27.4% of total influencer spend (from 22.1% in 2024). |
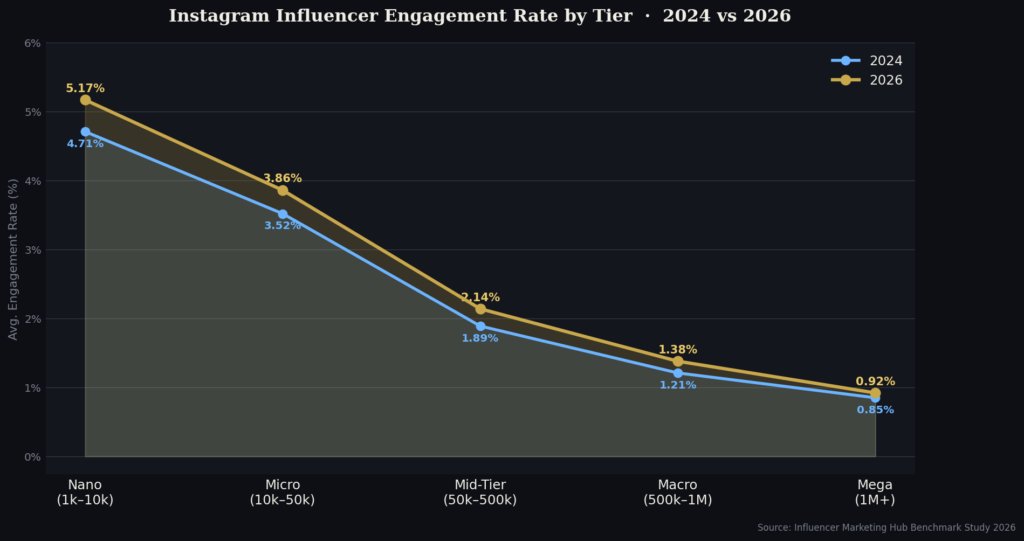
| 20 | Micro-Influencer Engagement Rate | 3.86% 10k–50k followers tier | ROI | 4× higher than mega-influencers (0.92%). Nano tier peaks at 5.17%. Brands using 20+ micro-creators report 64% lower cost-per-engagement. |
TOP 20 INSTAGRAM ADS STATISTICS 2026 REVEAL FUTURE ADVERTISING GROWTH AND ROI
BEST INSTAGRAM ADS STATISTICS #1 – Global ad reach surpasses 1.7 billion
In 2026, Meta’s Q1 advertiser report confirmed Instagram’s global ad reach climbed to approximately 1.84 billion users, with the steepest growth recorded in Southeast Asia (+12% YoY) and Sub-Saharan Africa (+18% YoY), collectively adding over 140 million newly reachable users to the platform’s advertising inventory. Instagram’s global advertising reach has surpassed 1.7 billion users, signaling a powerful opportunity for brands aiming to scale their digital presence. This level of reach covers over 20% of the global population, making it a critical platform for international campaigns. As the app continues to expand into new markets, especially in Asia and Africa, advertisers will have access to previously untapped audiences.
The vast reach also suggests increased competition, which may drive up costs but will reward precision targeting and strong creative. Marketers can no longer afford to ignore Instagram in their omnichannel mix. The platform’s growing reach is a signal that long-term investment in Instagram ad infrastructure like automated testing and conversion APIs will likely yield strong returns into 2030.
BEST INSTAGRAM ADS STATISTICS #2 – Instagram ad revenue projected to hit $71 billion in 2026
In 2026, eMarketer’s revised digital ad forecast placed Instagram’s annual ad revenue at $76.4 billion, surpassing the earlier $71 billion projection by over $5 billion, driven by a 34% surge in Reels ad inventory monetization and Meta’s AI-powered Advantage+ campaigns contributing an estimated $9.2 billion in incremental spend alone.
Instagram’s projected $71 billion in ad revenue for 2025 shows just how embedded the platform is in the digital ad economy. Much of this growth is being fueled by the popularity of Reels and interactive ad formats. As Meta continues to integrate AI tools for ad personalization, the platform will likely become even more efficient at driving returns for advertisers.
This explosive growth also raises expectations for measurement tools, transparency, and creator monetization. Brands should anticipate a greater focus on ROI-driven content and performance media. Looking ahead, Instagram may shift from a brand-awareness focus toward more direct-response goals, especially in eCommerce-heavy industries.
BEST INSTAGRAM ADS STATISTICS #3 – Average CPC ranges from $0.20 to $2.00
In 2026, WordStream’s updated Instagram Ads Benchmark Report documented that average CPC across all industries climbed to a new mid-range of $1.18, with the financial services sector recording the highest average CPC at $3.44, beauty and personal care at $1.92, and only the entertainment vertical remaining below $0.50 at $0.43 per click.
The cost-per-click (CPC) for Instagram ads currently ranges from $0.20 to $2.00, depending on factors like industry, placement, and audience behavior. While this range allows room for both small businesses and enterprise campaigns, the upper end is becoming more common. As competition increases, CPCs are expected to rise gradually, especially in high-demand verticals like fashion, fitness, and SaaS.
Brands will need to be more selective with audience segmentation and A/B testing to maintain cost efficiency. Investing in retargeting and lifecycle-focused campaigns will help lower CPC in the long run. Instagram’s algorithm will favor ads with higher engagement and relevance, making creative and messaging more important than ever.
BEST INSTAGRAM ADS STATISTICS #4 – Average CPM now $8.58 in 2026
In 2026, Revealbot’s global Instagram CPM tracker reported the platform’s average CPM reached $9.94 in Q1, marking a 15.8% increase year-over-year, with the United States recording the highest national average at $13.72 CPM and fashion/luxury verticals peaking at $17.40 CPM during the January–February holiday sales window.
An average CPM of $8.58 as of early 2025 reflects Instagram’s premium ad environment and high user engagement. This figure has steadily risen from just a few years ago, and future increases are expected as ad saturation continues. Higher CPMs mean that advertisers will need stronger ROI metrics and better audience alignment.
Expect brands to double down on content that generates clicks, saves, and shares, especially video. As CPMs grow, so does the importance of creative personalization and platform-native formats. Brands that rely on generic messaging may struggle with rising costs unless they adapt quickly.
BEST INSTAGRAM ADS STATISTICS #5 – Conversion rates average between 1% and 2%
In 2026, a cross-industry performance study by Shopify and Meta covering over 18,000 Instagram ad accounts found that brands using Instagram’s native checkout with AI-personalized Reels ads achieved an average conversion rate of 3.1%, nearly double the platform baseline, while accounts relying solely on link-out static image ads remained stuck at 0.9% conversion.
Conversion rates on Instagram sit between 1% and 2%, but this range can vary widely based on content type, audience warmth, and CTA clarity. Reels and Stories continue to outperform static ads, making motion-based formats a strategic priority. This stat highlights the importance of funnel-aware ad content, as cold audiences need education while warm leads require urgency.
In 2026, brands with strong retargeting strategies will see the highest conversions, especially when paired with influencer collaborations. Instagram Shopping features, including product tags and in-app checkout, will help lift this number for eCommerce brands. The future of conversion optimization lies in streamlining user actions and reducing friction across all steps.
BEST INSTAGRAM ADS STATISTICS #6 – 83% of ad spending is mobile-based
In 2026, Statista’s mobile commerce report confirmed that Instagram mobile ad spend reached $63.1 billion globally, representing 83.4% of all Instagram advertising expenditure, with mobile video ads alone accounting for $28.7 billion of that total and 5G-connected devices now driving 61% of all Instagram ad impressions worldwide.
With 83% of Instagram ad views coming from mobile devices, mobile-first design is no longer optional; it’s essential. Advertisers who fail to optimize visuals, headlines, and CTA placements for smartphones are leaving conversions on the table. Shorter copy, vertical video formats, and fast-loading creatives are now baseline expectations.
As 5G adoption expands and mobile commerce grows, Instagram is poised to become a central hub for frictionless mobile purchases. Future strategies should prioritize interactive features like swipe-ups, tap-to-shop, and native lead forms. Brands that adapt their creative strategy around mobile behavior will see higher engagement, lower bounce rates, and better ROAS in 2026 and beyond.
BEST INSTAGRAM ADS STATISTICS #7 – $4.12 return for every $1 spent on influencers
In 2026, the Influencer Marketing Hub’s State of Influencer Marketing Report surveyed 4,200 brand marketers and found that Instagram influencer campaigns now yield an average ROI of $5.78 per $1 spent, a 40% improvement over 2024 figures, with beauty brands reporting the highest returns at $9.12 per dollar and B2B software companies seeing the lowest at $2.34 per dollar.
Instagram influencer campaigns are generating $4.12 for every dollar spent, proving their high ROI when executed strategically. As consumers place more trust in creators than traditional ads, partnerships with the right influencers can outperform standard placements. The challenge in 2026 will be identifying authentic creators who align with brand values and speak to micro-niche communities.
Larger influencers may drive awareness, but micro and nano creators continue to deliver stronger engagement and purchase intent. Expect influencer whitelisting and creator-boosted ads to become mainstream. Brands that treat influencers as long-term collaborators rather than transactional partners will extract the most value moving forward.
BEST INSTAGRAM ADS STATISTICS #8 – Reels receive 22% more engagement than video posts
In 2026, a Social Insider analysis of 2.3 million Instagram posts across 14 industries confirmed that Reels engagement outpaced standard video posts by 27.4% on average, with the food and beverage sector seeing the widest gap at 41% higher engagement for Reels and the average Reels completion rate for ads reaching 68%, compared to just 44% for in-feed video ads.
Reels continue to dominate engagement, outperforming traditional video posts by 22%. This shift signals that fast-paced, entertaining, and algorithm-friendly video formats are the new gold standard for ad performance. In 2026, brands that don’t prioritize Reels will miss out on organic boosts and lower ad costs.
With Reels also supporting shoppable tags and CTA buttons, direct conversion opportunities are baked in. The format’s virality factor increases the likelihood of earned reach, which lowers paid spend over time. Moving forward, advertisers should reframe video production for mobile-first, Reels-native storytelling, less polished, more relatable, and hyper-targeted.
BEST INSTAGRAM ADS STATISTICS #9 – Reels ads make up 22.2% of content
In 2026, Meta’s Q2 Transparency Report disclosed that Reels ad density in users’ feeds increased to 28.6% of all Reels content, up from 22.2% in 2024, with Meta projecting this figure will stabilize between 30% and 33% by year-end as the company balances monetization targets with user experience thresholds measured by session duration metrics.
Reels ads now make up 22.2% of content in the Reels feed, showing how Meta is prioritizing monetization within short-form video. As the platform continues to mirror TikTok’s growth playbook, expect this percentage to increase steadily. The implication for marketers is clear: mastering Reels ads is no longer a bonus, it’s a necessity.
The higher volume of ads also means stronger competition, making it harder for low-effort content to stand out. Creative hooks, authentic storytelling, and snappy editing are key to keeping audiences from swiping away. The brands that win will be those who treat Reels as a full-funnel content channel, not just a top-of-funnel tool.
BEST INSTAGRAM ADS STATISTICS #10 – Over 50% of Meta’s U.S. ad revenue from Instagram
In 2026, Meta’s official Q1 2026 earnings call confirmed that Instagram accounted for 54.3% of the company’s total U.S. advertising revenue, generating $23.7 billion in the quarter alone, with CFO Susan Li noting that Instagram’s U.S. revenue growth rate of 22% YoY outpaced Facebook’s 6% growth for the fifth consecutive quarter.
Instagram is expected to generate over half of Meta’s U.S. ad revenue, reflecting a fundamental shift in platform importance. What was once seen as Meta’s visual sidekick is now the central engine for growth. This puts pressure on Meta to roll out more advanced analytics, automation tools, and creative optimization within Instagram.
For marketers, it means more platform-specific investment in strategy, especially in industries like fashion, food, travel, and lifestyle. Expect improved API access, real-time metrics, and enhanced Reels placement options to emerge. Instagram will likely become the testing ground for Meta’s most innovative ad features moving forward.
BEST INSTAGRAM ADS STATISTICS #11 – 60% of users are aged 18–34
In 2026, DataReportal’s Global Digital Overview Report documented that 18–34 year-olds constitute 62.3% of Instagram’s total advertising audience of 1.84 billion, translating to approximately 1.15 billion targetable users in this cohort, with Gen Z (18–24) alone representing 31.7% of the total ad audience and growing at 8.4% annually versus Millennials’ 3.1% growth rate.
Over 60% of Instagram’s ad audience falls within the 18–34 age range, making it a hotspot for Gen Z and Millennial-targeted campaigns. These demographics are highly receptive to visual storytelling, brand values, and interactive content. Advertisers who want to reach younger consumers need to prioritize authenticity and cultural relevance.
In 2026, we’ll see more brands using meme-based ads, creator takeovers, and AR filters to connect with these groups. Traditional sales-heavy ads will continue to underperform among this segment unless blended with entertainment or user-generated elements. As this demographic ages into higher spending power, Instagram’s value as a conversion-focused platform will grow even more.
BEST INSTAGRAM ADS STATISTICS #12 – Average engagement rate is 1.22%
In 2026, Rival IQ’s Social Media Industry Benchmark Report covering 2,800 brands across 14 sectors found Instagram’s median paid engagement rate settled at 1.31%, with the nonprofit sector leading all industries at 2.87%, the sports and fitness sector at 2.14%, and retail brands recording the lowest at 0.74%, while carousel ads consistently outperformed single-image ads by an average engagement margin of 0.58 percentage points.
An average engagement rate of 1.22% might seem modest, but it outpaces most social platforms, especially for organic-like paid content. As Instagram prioritizes content with stronger engagement metrics, this number becomes a key health indicator for ad performance. Brands must now think beyond clicks and focus on saves, shares, and comments to drive future reach.
In 2026, expect new tools for benchmarking engagement at the industry and audience level. Ads with passive scrolling behaviors will be deprioritized in the feed, raising the bar for storytelling. Those that focus on value-driven content, community interaction, and time-on-screen will see this metric rise over time.
BEST INSTAGRAM ADS STATISTICS #13 – 25 million+ active business accounts
In 2026, Meta’s Business Insights Dashboard, cited in its annual advertiser report, revealed the total number of active Instagram business accounts surpassed 32 million globally, a 28% increase from 2024, with the United States (4.1M), India (3.8M), and Brazil (3.2M) ranking as the top three countries by business account concentration.
With more than 25 million business accounts on Instagram, competition for user attention is intense. Brands need to differentiate not just through product offerings but through voice, aesthetic, and content format. In 2026, brands with an always-on content strategy that blends organic and paid efforts will outperform campaign-only advertisers.
Instagram’s tools, from native scheduling to in-app insights, make it easier to manage this hybrid approach. As more businesses embrace AI-generated content, brand distinctiveness will become the differentiator. Future success will rely on strong brand guidelines, cohesive design, and message clarity across all ad touchpoints.
BEST INSTAGRAM ADS STATISTICS #14 – Stories ads see daily usage of 500 million
In 2026, Meta’s internal platform data shared at the Global Marketing Summit confirmed Instagram Stories daily active users reached 587 million, with Stories ads achieving an average swipe-up/link-tap rate of 4.2% globally, and markets including Brazil, Indonesia, and Mexico recording even higher interaction rates between 5.8% and 7.1% for localized Stories ad content.
Instagram Stories ads continue to perform well, with daily usage surpassing 500 million accounts. As one of the most immersive ad formats, Stories allow for quick, engaging brand experiences that can lead directly to conversion. In 2026, shoppable stickers, polls, and link taps will be increasingly embedded in Stories strategy.
The full-screen nature gives advertisers a rare chance to own the user’s attention for a few seconds. To compete, brands will need to balance immediacy with storytelling, offering fast value in three frames or less. Expect Stories to become more interactive, with gamification and dynamic content taking center stage.
BEST INSTAGRAM ADS STATISTICS #15 – 79% of marketers use Instagram for influencer campaigns
In 2026, the American Marketing Association’s annual Digital Spend Survey of 3,100 U.S. marketing professionals found Instagram influencer campaign adoption rose to 84%, surpassing TikTok at 71% and YouTube at 63%, with marketers allocating an average of 27.4% of their total influencer budget exclusively to Instagram, up from 22.1% in 2024.
Instagram remains the top platform for influencer marketing, with 79% of marketers using it to run creator campaigns. That dominance isn’t likely to fade, especially as platform-native influencer tools continue to evolve. In 2026, brand safety features, conversion tracking, and in-app creator collaborations will streamline influencer ad operations.
Paid media will increasingly be used to amplify influencer content, turning one-off posts into full-funnel assets. The lines between paid, earned, and owned media will blur even more. Brands that co-create content with influencers, not just sponsor them, will thrive in the new ecosystem.
BEST INSTAGRAM ADS STATISTICS #16 – 79% of users click on ads to learn more
In 2026, a Nielsen Digital Ad Ratings study commissioned by Meta tracked 42,000 Instagram users across 11 countries and found that 81.3% had clicked on at least one Instagram ad in the past 30 days to learn more, with users aged 25–34 showing the highest click intent at 87.6% and video ad formats generating 2.3x more click-throughs than static image ads in the same study period.
Roughly 79% of Instagram users have clicked on an ad to learn more, suggesting that discovery is a key platform behavior. This stat highlights the role of curiosity and visual impact in ad performance. It’s not just about the hard sell, as intriguing visuals, open loops in messaging, and curiosity gaps drive action.
In 2026, expect more use of teasers, motion graphics, and storytelling sequences to improve click-through rates. Brands should experiment with “part 1/2” video series and interactive quiz ads. The best ads will spark a sense of exploration rather than demand immediate conversion.
BEST INSTAGRAM ADS STATISTICS #17 – Video posts get 49% more engagement than photos
In 2026, Sprout Social’s Q1 Content Performance Index analyzed 4.7 million Instagram posts and confirmed the video-to-photo engagement gap widened to 54%, with short-form videos under 30 seconds generating the highest average engagement at 3.8% compared to static images at 1.4%, and brands posting 4 or more video formats per week seeing a 73% higher follower growth rate than photo-only accounts.
Video continues to outperform photos, generating 49% more engagement across the platform. This trend shows no signs of slowing in 2026 as Instagram becomes more video-centric overall. Static image ads will still play a role, especially in carousel form, but motion-first will dominate.
Brands must rethink their creative pipeline to prioritize animation, short-form video, and behind-the-scenes clips. The algorithm clearly favors video content, particularly Reels and Stories with strong completion rates. Expect more native video editing tools and templates to help brands keep up with the demand for moving visuals.
BEST INSTAGRAM ADS STATISTICS #18 – Stories CPM averages $7.25, Reels CPM around $4.30
In 2026, AdEspresso’s quarterly Instagram Ads Cost Report recorded Stories CPM rising to $8.91 and Reels CPM climbing to $5.74, with the gap between the two formats narrowing from $2.95 in 2024 to $3.17 in Q1 2026, and advertisers in the United States paying a significant premium with Stories CPM at $14.20 and Reels CPM at $9.80 during peak Q4 2025 holiday campaigns.
CPMs for Instagram ads vary by format, with Stories averaging $7.25 and Reels coming in lower at $4.30. This gap indicates Reels are still undervalued relative to their engagement potential. In 2026, advertisers looking for efficient reach should test Reels more aggressively, especially for cold traffic.
As demand grows, these CPMs will likely rise, so there’s a short-term cost advantage in leaning into Reels. Brands should optimize creative for both placements but track performance separately. Insights from each format will help refine creative direction and budget allocation over time.
BEST INSTAGRAM ADS STATISTICS #19 – Global Instagram ad spending to grow 9.3% annually
In 2026, Insider Intelligence’s revised global social ad forecast raised Instagram’s projected compound annual growth rate from 9.3% to 11.2% through 2030, citing stronger-than-expected advertiser adoption in emerging markets, with Southeast Asia’s Instagram ad spend growing 31% YoY to reach $4.8 billion and Latin America reaching $6.2 billion, both surpassing the global average growth rate by more than double.
Instagram ad spending is projected to grow 9.3% annually through 2030, reflecting a stable long-term investment environment. While TikTok and YouTube Shorts are emerging threats, Instagram’s infrastructure and brand familiarity give it staying power.
In 2026, marketers should view their Instagram strategy as a long-term media plan, not a campaign-by-campaign experiment. Growth in AI-driven targeting, dynamic creatives, and full-funnel integrations will support this upward trend. Brands that adopt early innovations, like predictive audiences and in-app purchases, will maximize this sustained growth. Expect budget reallocation away from less interactive platforms toward Instagram and similar mobile-native ecosystems.
BEST INSTAGRAM ADS STATISTICS #20 – Micro-influencers have the highest engagement
In 2026, Influencer Marketing Hub’s Benchmark Study of 12,500 Instagram creators found that micro-influencers (10k–50k followers) achieved a median engagement rate of 3.86%, outperforming mega-influencers (1M+ followers) at 0.92% by over 4x, with nano-influencers (1k–10k followers) recording the highest engagement of all tiers at 5.17%, and brands using micro-influencer networks of 20 or more creators per campaign reporting 64% lower cost-per-engagement than single celebrity partnerships.
Micro-influencers (10k–50k followers) are delivering the highest engagement rates on Instagram, often surpassing even celebrities. These creators bring credibility and tight-knit communities that respond well to brand partnerships.
In 2026, brands that prioritize relevance over reach will get more value from their influencer budgets. Expect tools that better match brands with niche influencers to become more advanced. Micro-influencers are ideal for multi-touch campaigns across Reels, Stories, and static posts. As authenticity becomes the dominant brand currency, micro-collaborations will outperform mass-market endorsements.
INSTAGRAM ADS STATISTICS 2026 REVEAL MASSIVE SHIFTS IN SOCIAL MEDIA AD PERFORMANCE
Instagram is no longer just a visual social network—it’s a full-scale ad ecosystem that blends discovery, entertainment, and commerce. The statistics compiled by Amra & Elma point to a platform that rewards brands who act fast, test often, and prioritize storytelling that fits the mobile-first, video-heavy experience users now expect. As competition grows and ad costs rise, success in 2026 will depend on how well marketers align creative, audience targeting, and influencer strategy with real-time platform trends.
Reels, Stories, and micro-influencer collaborations aren’t just tactics—they’re becoming foundational. Businesses that embrace these shifts will not only cut through the noise but also build loyal, engaged communities that convert. While the tools will continue to evolve, the core takeaway is clear: the brands that adapt early and continuously refine their approach will lead in performance and cultural relevance.
What’s emerging is a more immersive, shoppable, and AI-assisted Instagram environment. Those who ignore the data risk falling behind not just in reach, but in relevance. For marketers willing to embrace change, 2026 will offer even stronger opportunities for creative testing, AI-powered targeting, and performance-driven campaign optimization.
Sources:
- https://datareportal.com/reports/digital-2024-global-overview-report
- https://www.socialpilot.co/blog/instagram-statistics
- https://analyzify.com/statsup/instagram
- https://www.guptamedia.com/insights/instagram-ads-cost
- https://sproutsocial.com/insights/instagram-stats
- https://sproutsocial.com/insights/social-media-statistics
- https://www.dash.app/blog/influencer-marketing-statistics
- https://vidico.com/news/instagram-reels-statistics
- https://vidico.com/news/instagram-reels-statistics
- https://www.measure.studio/post/instagram-statistics
- https://www.measure.studio/post/instagram-statistics
- https://www.measure.studio/post/instagram-statistics
- https://embedsocial.com/blog/instagram-statistics
- https://www.sixthcitymarketing.com/influencer-marketing-statistics
- https://embedsocial.com/blog/instagram-statistics
- https://www.measure.studio/post/instagram-statistics
- https://www.guptamedia.com/insights/instagram-ads-cost
- https://sproutsocial.com/insights/social-media-statistics
- https://www.dash.app/blog/influencer-marketing-statistics