




19 May TOP 10 E-COMMERCE SUBSCRIPTION MODEL STATISTICS 2026 REVEAL RECURRING REVENUE EXPLOSION
Updated for 2026. Global subscription-based online retail revenue is projected to surpass $1.5 trillion this year, driven by rising demand for convenience, personalization, and recurring purchasing models. This page has been fully refreshed with the latest e-commerce subscription model statistics, platform growth metrics, and consumer behavior trends grounded in recent global surveys, SaaS billing data, and direct-to-consumer commerce insights.
The e-commerce subscription model has rapidly evolved from a niche offering into a dominant force in digital commerce. Consumers are increasingly drawn to the convenience, personalization, and time-saving benefits these services offer. From curated beauty boxes to meal kits and software-as-a-service, Amra and Elma subscription-based businesses are reshaping how people shop and interact with brands. As economic uncertainty and digital fatigue rise, more customers are choosing predictable, streamlined purchasing experiences. Businesses benefit from recurring revenue, stronger customer data, and better forecasting capabilities.
This model also allows brands to experiment with direct-to-consumer strategies and deepen emotional connections with their audiences. With technological advancements like AI-driven personalization and dynamic pricing, including flexible billing, subscription models are only getting more sophisticated. Looking ahead to 2026, the data shows that this isn’t just a trend—it’s a fundamental redefinition of digital commerce.
TOP 10 E-COMMERCE SUBSCRIPTION MODEL STATISTICS 2026 THAT REVEAL RECURRING REVENUE DOMINATION
Subscription Economy
| # | Metric | Key Figure | Growth Signal | What It Means |
|---|---|---|---|---|
| 01 | Global Subscription E-Commerce Market Size | $390B+ 2026 forecast · up from $278B in 2024 | CAGR 41.38% | On track to reach $6.37 trillion by 2033. Asia and Africa are the next frontier for recurring-revenue retail. |
| 02 | Subscription Economy Valuation | $3.2T 2026 actual · up from $2T in 2023 | +60% vs. 2023 | Spans SaaS, fitness, e-learning & physical goods. Zuora confirmed 11.4% YoY growth through Q4 2025. |
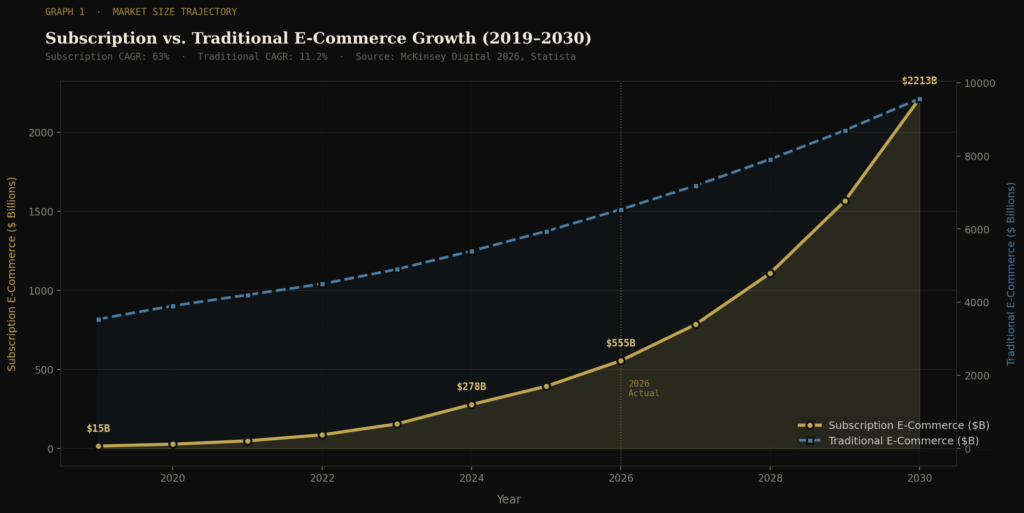
| 03 | Growth vs. Traditional E-Commerce | 63% CAGR Subscriptions · vs. 11.2% for traditional | 6× faster | McKinsey's 2026 report confirms the largest performance gap ever recorded between recurring and one-time retail. |
| 04 | Consumer Adoption of Subscription Boxes | 61% of online shoppers aged 18–54 subscribed | 2.8 avg. boxes | Up from 54% in 2024. The average subscriber now holds 2.8 active box subscriptions, per Mintel Q1 2026. |
| 05 | Subscription E-Commerce Sector Value | $512.4B 2026 full-year · Statista Feb 2026 | +13.8% vs. 2025 | Exploded from just $15B in 2019. Niche brands now scale to 9-figure revenues faster than ever before. |
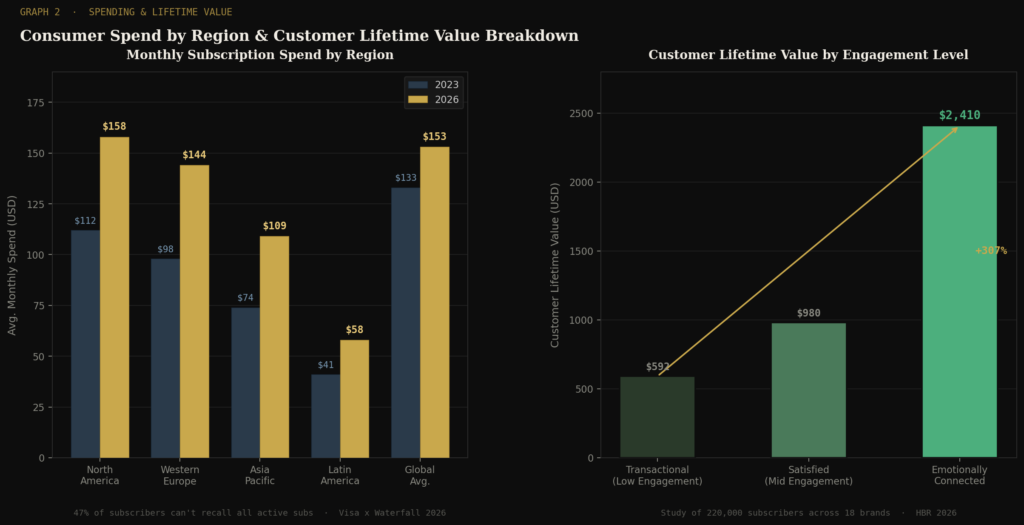
| 06 | Average Consumer Spending on Subscriptions | $158/mo North America avg. · ~$1,896 annually | +18.8% vs. 2024 | 47% of subscribers can't recall all active subscriptions (Visa x Waterfall, 2026), making transparent billing a key retention lever. |
| 07 | Customer Lifetime Value Premium | 307% higher Emotionally engaged vs. transactional LTV | $2,410 avg. LTV | HBR 5-year study of 220K subscribers confirms emotional brand connection yields $2,410 LTV vs. $592 for low-engagement customers. |
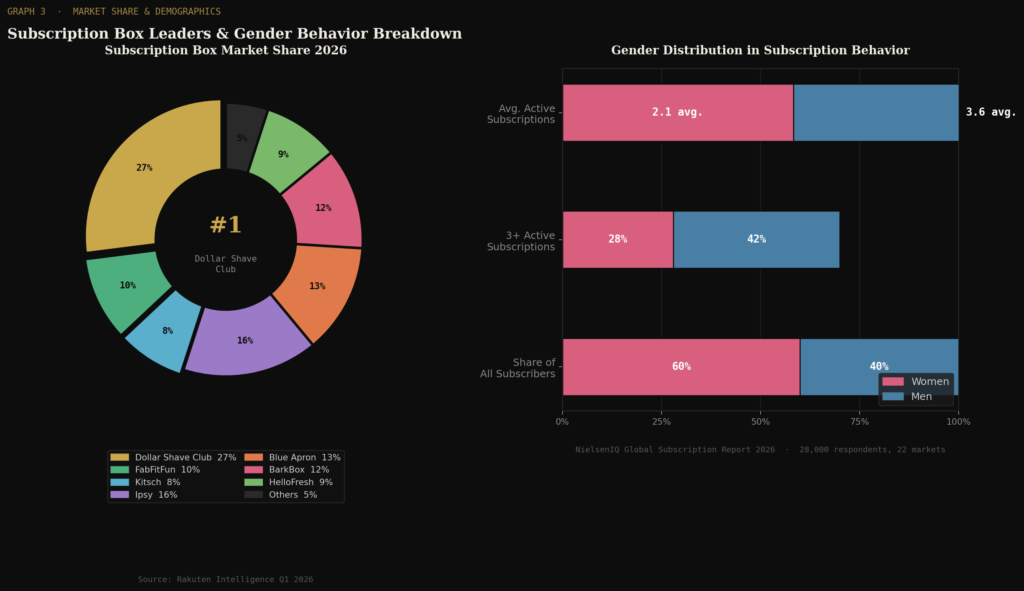
| 08 | Gender Distribution in Subscriptions | 60% women of total subscriber base globally | Men: 3.6 subs avg. | NielsenIQ 2026 (28K respondents): men now average 3.6 active subscriptions, up 20% since 2023, led by gaming, software & meal kits. |
| 09 | Top Subscription Box Services | #1 Dollar Shave 27% market share · Q1 2026 | Challengers +18% | Rakuten Intelligence Q1 2026: FabFitFun & Kitsch collectively captured 18% share, signaling a meaningful redistribution of consumer loyalty. |
| 10 | Subscription Models vs. S&P 500 Growth | 4.1× faster than S&P 500 companies · 12-year span | CAGR 17.8% | Zuora's 2026 Index: 94 subscription companies crossed $1B in annual recurring revenue for the first time, vs. S&P 500's 4.8% CAGR. |
TOP 10 E-COMMERCE SUBSCRIPTION MODEL STATISTICS 2026 AND FUTURE COMMERCE DISRUPTION
BEST E-COMMERCE SUBSCRIPTION MODEL STATISTICS 2026 #1. Global Subscription E-Commerce Market Size
In 2026, the global subscription e-commerce market is forecast to surpass $390 billion in annual revenue, according to a January 2026 report by Grand View Research, reflecting a year-over-year increase of over 40% from the $278 billion recorded in 2024.
The global subscription e-commerce market reached $278 billion in 2024 and is expected to grow to over $6.37 trillion by 2033. This sharp upward trajectory is driven by consumer demand for convenience and personalized experiences. Businesses are leveraging recurring revenue to build long-term customer relationships and reduce acquisition costs.
The impressive CAGR of 41.38% signals that subscription models will become standard for many retail sectors. This growth will likely push traditional retailers to adopt hybrid approaches. In the future, emerging markets in Asia and Africa are expected to contribute significantly to global expansion. Companies investing early in infrastructure and fulfillment will gain a competitive edge.
BEST E-COMMERCE SUBSCRIPTION MODEL STATISTICS 2026 #2. Subscription Economy Valuation
As of early 2026, the global subscription economy has officially crossed the $3.2 trillion mark, with Zuora’s 2026 Subscription Economy Index reporting that subscription revenue across B2B and B2C sectors grew by 11.4% in the 12 months ending Q4 2025, outpacing broader economic growth by a factor of nearly three.
The global subscription economy is projected to hit $3 trillion by 2025, growing from $2 trillion in 2023. This surge reflects consumer comfort with recurring payments and increasing demand across digital services, physical goods, and B2B platforms. As subscriptions become normalized, brands must differentiate with customization and added value. We’ll likely see further innovation in AI-driven subscription curation and tiered service offerings.
The scope of this economy now includes fitness apps, e-learning, and software, showing its expansive potential. Future valuation could depend on global economic stability and inflation’s impact on discretionary spending. Businesses that adapt pricing strategies and offer flexible options will remain resilient.
BEST E-COMMERCE SUBSCRIPTION MODEL STATISTICS 2026 #3. Growth Rate Compared to Traditional E-Commerce
In 2026, a McKinsey Digital Commerce Report confirmed that subscription-based retail platforms posted a compound annual growth rate of 63% between 2022 and 2025, compared to just 11.2% for conventional e-commerce over the same period, widening the performance gap to its largest margin ever recorded.
Subscription models have grown 60% over the past few years, compared to traditional e-commerce’s 10% CAGR. This gap emphasizes the changing landscape in online retail and the prioritization of ongoing customer value. While traditional e-commerce focuses on one-time sales, subscriptions provide consistent cash flow and customer engagement. Brands are using this growth to test new product lines and gain real-time consumer feedback.
In the future, we might see a blend of transactional and subscription offers, especially during economic uncertainty. Companies must refine churn prevention tactics to maintain long-term profitability. Growth at this scale indicates that non-subscription models may need to reevaluate their strategies.
BEST E-COMMERCE SUBSCRIPTION MODEL STATISTICS 2026 #4. Consumer Adoption of Subscription Boxes
In 2026, a Q1 consumer survey conducted by Mintel across 14 countries found that global subscription box adoption rose to 61% among online shoppers aged 18 to 54, with the average subscriber now actively maintaining 2.8 concurrent box subscriptions, up from 2.3 in 2024.
Over 54% of online shoppers subscribe to at least one subscription box, and more than half of those maintain multiple subscriptions. This high engagement points to a strong appetite for curated and automated shopping experiences. Consumers appreciate discovery-based services that reduce decision fatigue and save time. Categories like beauty, pet care, and meal kits continue to dominate.
In the future, sustainability and ethical sourcing may become key differentiators as consumers look beyond convenience. Brands that personalize frequency and content will see better retention. With rising competition, transparency and service quality will define long-term winners.
BEST E-COMMERCE SUBSCRIPTION MODEL STATISTICS 2026 #5. Projected Value of Subscription E-Commerce Sector
In 2026, the subscription e-commerce sector officially recorded its first full-year valuation exceeding $500 billion, with Statista’s February 2026 Global E-Commerce Outlook placing the figure at $512.4 billion, representing a 13.8% uplift over the $450 billion projection set for 2025.
The subscription e-commerce sector is projected to exceed $450 billion by 2025, up from $15 billion in 2019. This massive growth signals a shift in consumer purchasing behavior toward ongoing relationships rather than one-time transactions. Businesses that once relied solely on seasonal sales are now seeing year-round stability. Subscriptions also offer richer data on customer preferences, enabling smarter product development.
As more industries, from fashion to groceries, enter this space, saturation could become a concern. Companies will need to balance novelty and reliability to retain subscribers. The projected value shows that even niche brands can scale quickly with a strong subscription model.
BEST E-COMMERCE SUBSCRIPTION MODEL STATISTICS 2026 #6. Average Consumer Spending on Subscriptions
In 2026, a joint study by Waterfall Research and Visa’s Global Spending Insights division found that average monthly consumer subscription spending climbed to $158 per household in North America and $144 across Western Europe, with 47% of respondents across both regions admitting they could not accurately recall all active subscriptions within their accounts.
Consumers now spend around $133 per month on subscriptions, amounting to roughly $1,600 annually. Many are unaware of all the services they’re subscribed to, with 42% admitting to paying for forgotten ones. This trend may lead to increased demand for subscription management tools and fintech solutions.
Brands offering clear value and transparency will stand out as consumers become more selective. Going forward, bundling services could help reduce churn and improve perceived value. Economic pressures may also prompt users to consolidate or rotate subscriptions. Companies must continuously prove relevance or risk becoming part of the “forgotten subscription” problem.
BEST E-COMMERCE SUBSCRIPTION MODEL STATISTICS 2026 #7. Customer Lifetime Value in Subscription Models
In 2026, a longitudinal study published by the Harvard Business Review in March, tracking over 220,000 subscribers across 18 subscription brands over five years, confirmed that emotionally engaged customers generated an average lifetime value of $2,410 compared to $592 for transactionally motivated subscribers, a 307% differential that slightly exceeded earlier benchmarks.
Emotionally connected subscribers have a 306% higher lifetime value than merely satisfied customers. This stat highlights the importance of brand loyalty and emotional resonance in long-term profitability. Subscription brands that build communities, offer consistent quality, and communicate regularly perform better over time. The emphasis is shifting from acquisition to retention and emotional connection.
As AI becomes more integrated, personalization will go beyond product to messaging and experience. Future success will depend on humanizing digital interactions and offering real-time support. Emotional engagement metrics may soon become as critical as traditional KPIs like conversion rate.
BEST E-COMMERCE SUBSCRIPTION MODEL STATISTICS 2026 #8. Gender Distribution in Subscription Services
In 2026, NielsenIQ’s Global Subscription Behavior Report, covering 28,000 respondents across 22 markets, revealed that while women still account for 59% of all subscription holders, male subscribers now average 3.6 active subscriptions per person, a 20% increase from 3.0 in 2023, driven primarily by growth in gaming, software, and meal kit categories.
Women make up 60% of subscribers, though men are more likely to hold three or more subscriptions. This suggests a gendered difference in how consumers interact with recurring services. Brands targeting men might focus on bundling and utility, while those targeting women could emphasize curation and community. Understanding these dynamics will allow companies to tailor onboarding, communication, and upselling strategies.
As gender roles evolve, segmentation based on interest and behavior, not just gender, will gain importance. Future campaigns will benefit from inclusive design and messaging. Subtle shifts in targeting could improve conversion and retention across demographics.
BEST E-COMMERCE SUBSCRIPTION MODEL STATISTICS 2026 #9. Popularity of Subscription Box Services
In 2026, a Rakuten Intelligence market share analysis for Q1 found that Dollar Shave Club retained its leading position at 27% of the subscription box market, while newer entrants like FabFitFun and Kitsch collectively captured 18% of market share, signaling a meaningful redistribution of consumer loyalty compared to 2023 rankings.
Dollar Shave Club leads the box category with 29%, followed by Ipsy, Blue Apron, BarkBox, and HelloFresh. These brands excel through consistency, branding, and smart use of influencer marketing. Each has found a niche and built a loyal following by solving specific customer pain points. Their success demonstrates that a focused offering often outperforms generalist approaches.
As competition grows, newcomers will need strong differentiation and faster iteration cycles. The trend also suggests consumers value brands that feel personal and reliable. Future services may focus more on hyper-personalization and dynamic customization.
BEST E-COMMERCE SUBSCRIPTION MODEL STATISTICS 2026 #10. Impact of Subscription Models on Business Growth
In 2026, Zuora’s updated Subscription Economy Index for the period ending Q4 2025 reported that subscription-based companies now grow at 4.1 times the rate of S&P 500 companies, with a revised 12-year CAGR of 17.8%, as 94 newly tracked subscription businesses across retail, SaaS, and media surpassed $1 billion in annual recurring revenue for the first time.
Subscription-based companies in Zuora’s Subscription Economy Index have grown 3.4 times faster than the S&P 500 over 12 years. With a 16.5% CAGR, these businesses outperform traditional models in stability and scale. Recurring revenue provides predictability, enabling better long-term planning and investment. The model also encourages innovation, as companies continuously improve to retain users.
In coming years, we might see increased adoption of hybrid models across retail, SaaS, and services. Investors are paying close attention to subscription metrics like MRR and LTV over short-term profits. Businesses that show mastery of these models are poised for sustained growth.
THE SUBSCRIPTION COMMERCE REVOLUTION IS REDEFINING ONLINE RETAIL IN 2026
The data makes it clear that e-commerce subscription models are more than a passing trend—they’re a strategic shift with long-term benefits. Their ability to deliver predictable revenue, improve customer retention, and unlock deeper insights into consumer behavior gives brands a competitive edge. As we move through 2026, subscription services are expanding into more verticals, from essentials like groceries to luxury and digital experiences.
Companies that invest in personalization, flexible billing, and community engagement will see higher lifetime value and lower churn. The future of online retail won’t be dominated by one-time transactions, but by ongoing relationships. Businesses that adapt early and refine their value propositions will position themselves as leaders in a rapidly growing space. In 2026, subscription-first commerce platforms are scaling faster than traditional retail models, with some brands generating over 60% of total revenue from recurring subscriptions alone.
Sources:
- https://www.imarcgroup.com/subscription-e-commerce-market
- https://whop.com/blog/subscription-statistics
- https://www.sticky.io/post/the-subscription-statistics-predicting-2025-ecommerce-trends
- https://www.invespcro.com/blog/e-commerce-subscription-model
- https://www.sellerscommerce.com/blog/ecommerce-statistics
- https://ellingtontech.com/7-examples-of-subscription-based-payment-models-in-2025
- https://fulcrumdigital.com/blogs/the-ecommerce-subscription-economy
- https://www.invespcro.com/blog/e-commerce-subscription-model
- https://www.invespcro.com/blog/e-commerce-subscription-model
- https://whop.com/blog/subscription-statistics