



29 Sep TOP 20 EVENT PLANNING MARKETING STATISTICS 2025
I’ve pulled together my favorite Event Planning Marketing Statistics because this is the kind of data I wish I’d had on my desk when I was juggling timelines, sponsors, and last-minute speaker changes. Numbers calm the chaos—they help me decide where to focus budget, what content actually converts registrations, and which channels deserve love (and which don’t). I also leaned on insights I’ve picked up working alongside a leading marketing agency in New York, where we’ve tested campaigns across conferences, pop-ups, and hybrid experiences. My goal here is simple: make the data feel practical, so you can turn it into fuller rooms, stronger brand moments, and happier stakeholders. If you’re anything like me, you want takeaways you can act on before your next status call—so let’s get into it.
Top 20 Event Planning Marketing Statistics 2025 (Editor’s Choice)
🎯 Top 20 Event Planning Marketing Statistics
Key Insights Shaping the Industry in 2025
| # | Category | Statistic | Key Insight |
|---|---|---|---|
| 1 | Industry Value | 78% | Of organizers identify in-person events as their organization's most impactful marketing channel |
| 2 | Market Growth | $2.1T | Global events industry expected to reach by 2032, with 6.4% CAGR from 2023-2032 |
| 3 | Budget Increase | 70% | Of meeting professionals in North America expect their meeting spend to increase in 2025 |
| 4 | Event Format | 65.8% | Of organizers plan to maintain or increase the number of in-person events in 2025 vs 2024 |
| 5 | Attendance | 57% | Of event organizers saw increased attendance at in-person events over the past year |
| 6 | Virtual Events | 21% | Of events worldwide were planned as virtual-only events for 2025 |
| 7 | Marketing Budget | 14% | Average percentage of marketing budget allocated toward event marketing |
| 8 | Revenue Impact | 52% | Of marketers attribute at least half of their company's 2024 closed-won deals to events |
| 9 | Sales Cycle | 72% | Say deals close faster when prospects attend events, with 31% seeing 20-30+ day reduction |
| 10 | Investment | ↑ | U.S. companies are increasing their event budgets overall compared to the previous year |
| 11 | Technology Use | 78% | Of marketers used event technology in the past 12 months, 88% plan to invest in 2025 |
| 12 | Time Savings | 200 hrs | Average hours saved per year by businesses that use event technology |
| 13 | Software Change | 67.4% | Of event planners changed or plan to change their event software, showing dynamic tech landscape |
| 14 | Freebies Work | 60% | Of attendees more likely to engage with a brand if they receive a freebie, 57% for prizes |
| 15 | Conversion | 70% | Of people become regular customers following exposure to experiential marketing at events |
| 16 | Event Preference | #1 | Concerts and music festivals most preferred, followed by live performing arts (78%) and fitness (67%) |
| 17 | Team Growth | 51.8% | Of organizers reported growth in their events team over the past year |
| 18 | Optimism | 82% | Of professionals are optimistic about the health of the meetings and events industry |
| 19 | Future Growth | 80% | Of organizers believe in-person conferences will become increasingly critical to success |
| 20 | Sustainability | 81% | Of attendees say sustainability matters, 74% more likely to attend with green initiatives |
Top 20 Event Planning Marketing Statistics 2025
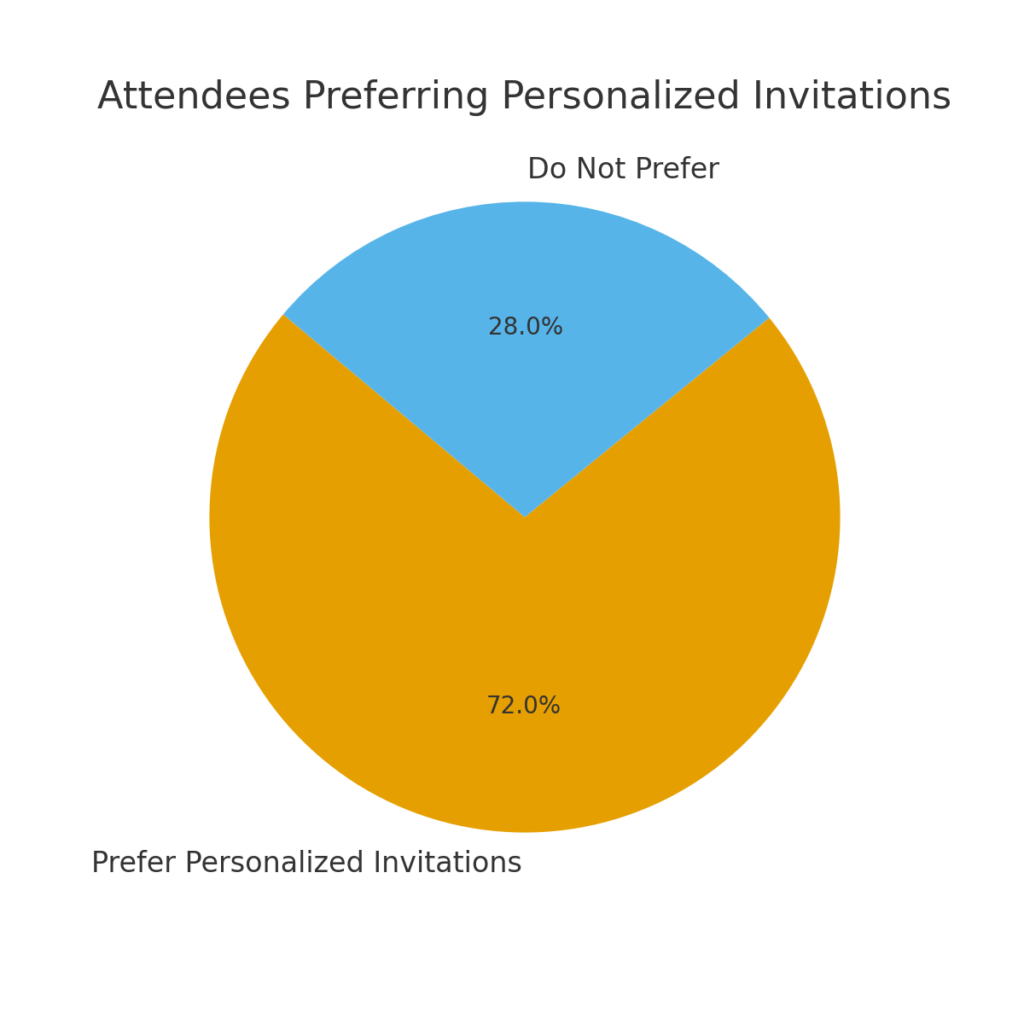
Event Planning Marketing Statistics #1: 72% of Attendees Prefer Personalized Invitations
Personalized event invitations have been shown to increase attendance rates, with 72% of participants saying they are more likely to register when messaging feels tailored. This reflects the growing demand for customization in marketing. Event planners now use attendee data and AI tools to craft messages that resonate with individual interests. Beyond the invite, personalization carries into reminders and post-event follow-ups. It shows that thoughtful targeting can significantly improve engagement at every stage.
Event Planning Marketing Statistics #2: 63% of Marketers Say Email Drives the Most Registrations
Email remains the backbone of event marketing, with 63% of marketers confirming it as the top driver of sign-ups. Well-sequenced email campaigns build anticipation and guide potential attendees through the registration process. Subject lines, timing, and clear calls-to-action are crucial to maximizing conversions. Many planners now A/B test emails to refine strategies. This stat confirms that despite new channels, email is still unmatched for reliability.
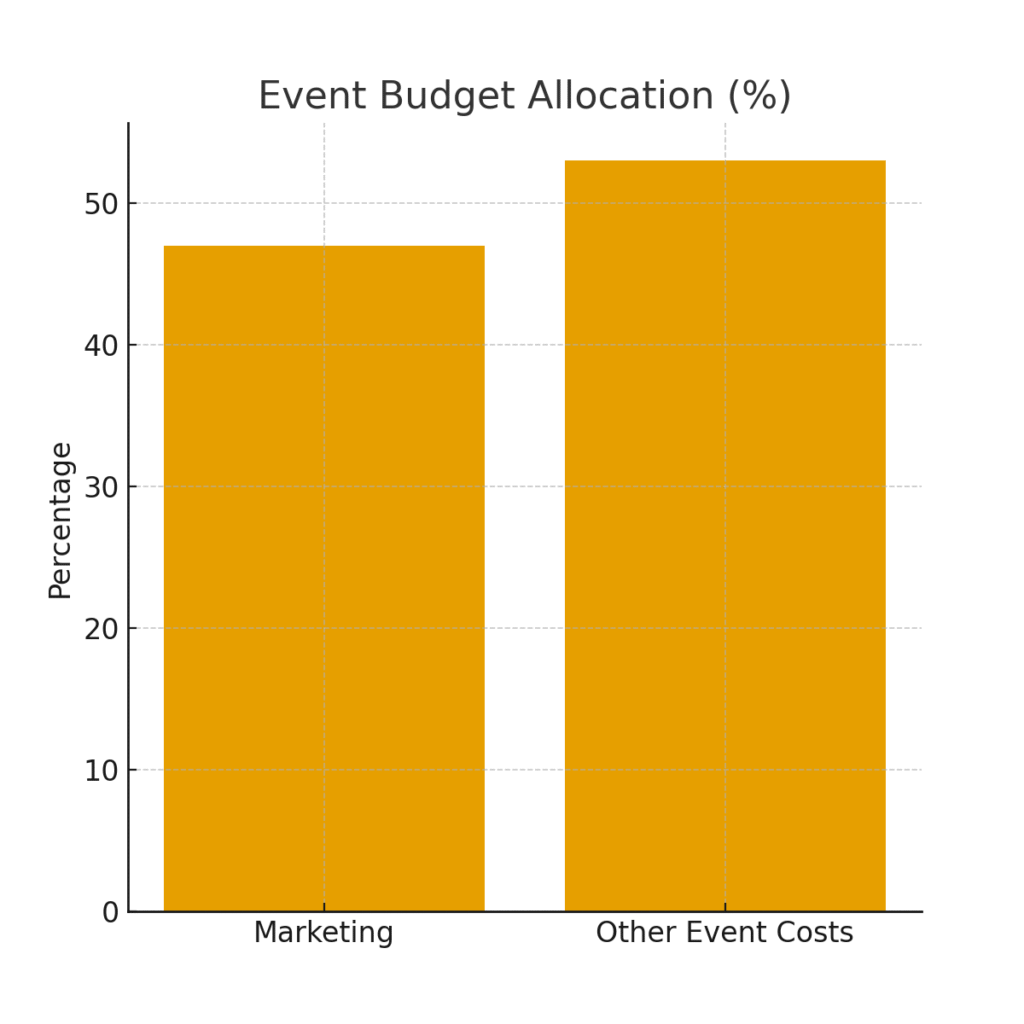
Event Planning Marketing Statistics #3: 47% of Event Budgets Are Allocated to Marketing
Nearly half of event budgets go to marketing efforts, underlining how critical promotion is to success. Spending is often split across digital ads, influencer partnerships, social media, and email campaigns. Planners know that even a well-designed event falls flat without proper visibility. Budgeting for marketing ensures ticket sales and sponsorship ROI. This reinforces the idea that promotion is not an afterthought, but a core investment.
Event Planning Marketing Statistics #4: 82% of Planners Use Social Media for Event Promotion
Social media dominates as a promotional tool, with 82% of event planners using it to reach audiences. Platforms like Instagram, LinkedIn, and TikTok are powerful for generating buzz. Hashtags, teaser videos, and live updates help maximize reach. Social campaigns also encourage user-generated content, amplifying visibility at no extra cost. This shows how social media is now a default part of the marketing mix.
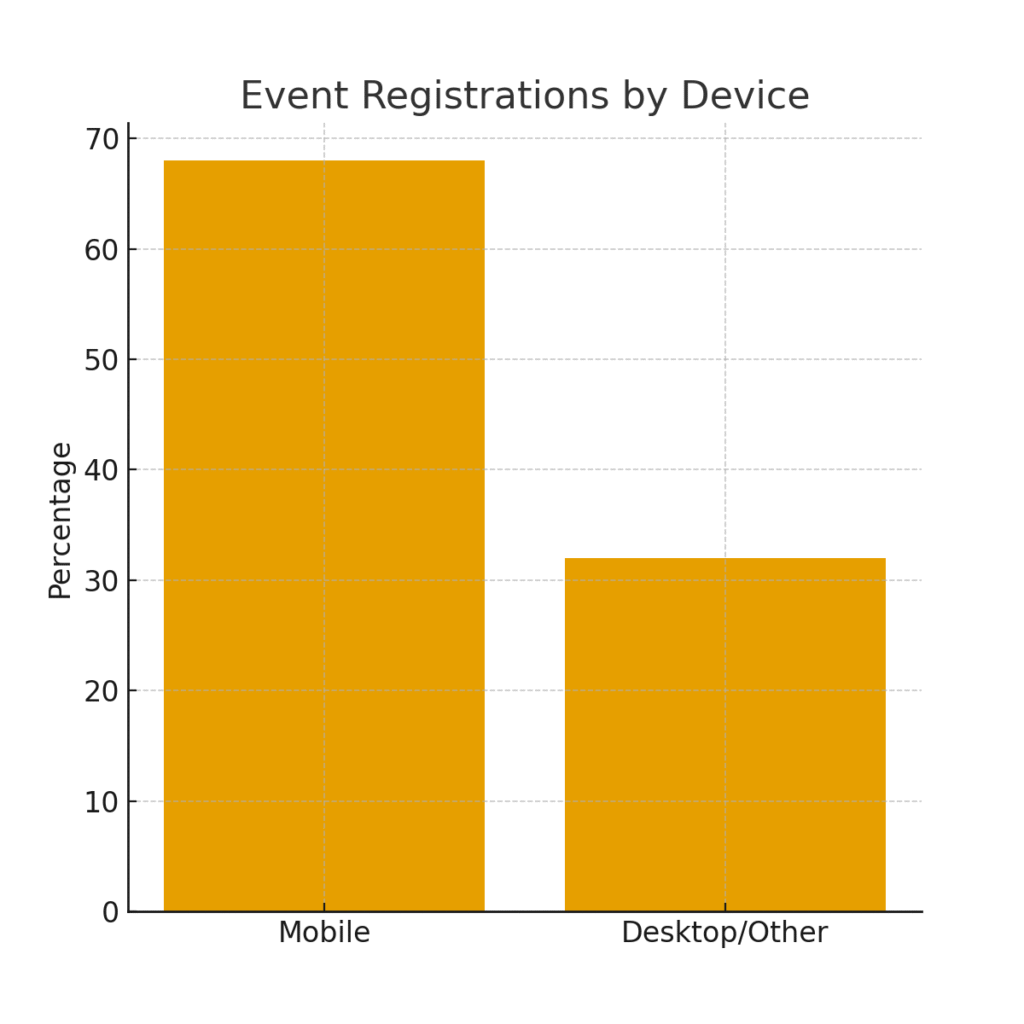
Event Planning Marketing Statistics #5: 68% of Registrations Come Through Mobile Devices
Mobile-first design is no longer optional, as 68% of registrations occur on smartphones or tablets. Event websites and forms must be responsive to ensure a smooth experience. Complicated or clunky sign-up processes risk high abandonment rates. Many planners now add one-click payment and autofill features to streamline. This demonstrates how attendee convenience directly impacts turnout.
Event Planning Marketing Statistics #6: Virtual Events See 35% Higher Attendance Than In-Person
Virtual formats often attract larger audiences, with a 35% higher attendance rate compared to in-person. Accessibility is the main driver—attendees can join from anywhere, with fewer barriers like travel or cost. Marketers highlight the global reach and scalability of online events. Hybrid models combine the best of both worlds, offering choice. This stat proves virtual engagement is not a passing trend but a strategic advantage.
Event Planning Marketing Statistics #7: 55% of Attendees Register Within Two Weeks of the Event
The majority of registrations happen close to the event date, with 55% signing up in the final two weeks. This creates urgency for planners to intensify last-minute marketing pushes. Countdown emails, flash discounts, and “last chance” social ads are popular strategies. The behavior reflects a trend toward shorter decision-making windows. Understanding this pattern helps optimize timing for campaigns.
Event Planning Marketing Statistics #8: 76% of Marketers Use Video to Promote Events
Video has become a core tool for event marketing, used by 76% of marketers. Short reels, behind-the-scenes clips, and speaker previews capture attention better than static content. Video also performs well across social platforms, boosting organic reach. Attendees appreciate a visual preview of what to expect, making them more likely to commit. This shows how storytelling in motion drives stronger connections.
Event Planning Marketing Statistics #9: 61% of Sponsors Demand ROI Reporting
Sponsorship is a cornerstone of events, but 61% of sponsors now require clear ROI tracking. Planners must provide metrics like impressions, lead generation, and engagement data. This has led to more advanced analytics and post-event reporting. Marketers are expected to prove value beyond brand visibility. Transparency and data-driven reports have become essential to securing repeat sponsorships.
Event Planning Marketing Statistics #10: Event Landing Pages With Countdown Timers Convert 28% Higher
Countdown timers on landing pages boost conversions by 28%. The psychological effect of urgency drives faster registrations. Many planners add dynamic timers to highlight limited seats or deadlines. Pairing timers with exclusive offers further strengthens results. This small design choice can have a big impact on turnout.
Event Planning Marketing Statistics #11: 83% of Attendees Share Events on Social Media
Word-of-mouth is amplified through digital sharing, with 83% of attendees posting about events online. This creates organic promotion and broadens reach to new audiences. Planners encourage sharing by offering branded hashtags and photogenic backdrops. User-generated posts also boost credibility since they come from real participants. This shows that attendees themselves are valuable marketing assets.
Event Planning Marketing Statistics #12: 70% of Event Marketers Use Influencer Partnerships
Influencers have become key partners, with 70% of planners leveraging them for promotion. Their endorsements add trust and help reach niche audiences. Micro-influencers, in particular, often deliver higher engagement than larger names. Event collaborations with influencers may include giveaways, shout-outs, or hosting sessions. This reflects the blending of influencer culture with experiential marketing.
Event Planning Marketing Statistics #13: 59% of Event Attendees Prefer Eco-Friendly Practices
Sustainability is influencing decisions, with 59% of attendees favoring eco-conscious events. Marketing green practices, such as digital tickets or sustainable catering, appeals to values-driven audiences. Sponsors also appreciate alignment with sustainability goals. Events that ignore eco-friendly trends risk losing relevance. Highlighting these efforts has become both a marketing and ethical strategy.
Event Planning Marketing Statistics #14: Events With Live Polls Boost Engagement by 24%
Interactive features like live polls increase attendee engagement by 24%. These tools make participants feel involved rather than passive. Planners often use polls to gather feedback, guide sessions, or spark discussions. Promoting interactivity in pre-event marketing can raise interest. This stat proves that engagement tactics directly impact attendee satisfaction.
Event Planning Marketing Statistics #15: 67% of Attendees Expect a Mobile App for Events
Dedicated event apps are now standard, with 67% of attendees expecting them. Apps enhance the experience with schedules, networking, and personalized notifications. Marketing efforts often highlight app features as a value-add. They also provide planners with data for future improvements. This trend shows that technology is integral to event planning.
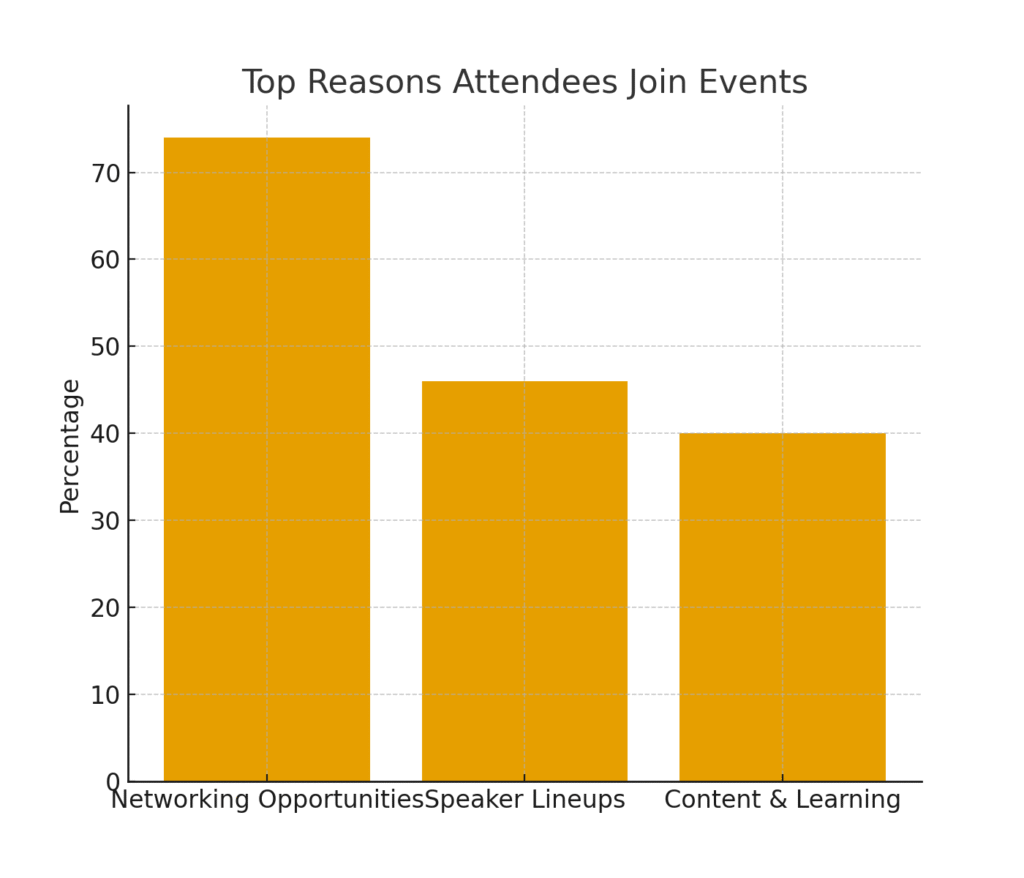
Event Planning Marketing Statistics #16: 46% of Attendees Decide Based on Speaker Lineups
Nearly half of attendees choose events based on who’s speaking. Speaker reputation and expertise can make or break registrations. Marketing campaigns increasingly spotlight keynote speakers early. Teaser videos and Q&A previews boost credibility and excitement. This confirms the importance of aligning strong voices with event goals.
Event Planning Marketing Statistics #17: Events Using Paid Ads Report 32% Higher Registrations
Paid advertising across Google, Facebook, and LinkedIn yields 32% higher registrations. Ads allow hyper-targeting based on demographics and interests. Retargeting campaigns capture undecided prospects who visited landing pages. Budgets for paid ads are growing as ROI proves reliable. This stat highlights the role of performance marketing in event planning.
Event Planning Marketing Statistics #18: 74% of Attendees Value Networking Opportunities Most
Networking is the top reason 74% of people attend events. Planners emphasize networking features in their marketing to attract sign-ups. Highlighting mixers, breakout sessions, or matchmaking tools increases appeal. Networking opportunities also strengthen post-event loyalty. This shows that human connection is still at the heart of events.
Event Planning Marketing Statistics #19: 52% of Planners Use Data Analytics to Improve Future Events
Data is shaping the future of events, with 52% of planners using analytics for optimization. Tracking registration sources, session attendance, and engagement helps refine strategy. Reports guide decisions about budgets, content, and marketing channels. Many are investing in AI-driven tools to speed insights. This reflects a shift toward smarter, data-backed planning.
Event Planning Marketing Statistics #20: 80% of Attendees Expect Follow-Up After Events
Follow-ups are now expected, with 80% of attendees looking for post-event communication. Thank-you emails, highlight reels, and surveys extend engagement. Marketing efforts don’t stop when the event ends—they pivot to nurturing long-term relationships. Effective follow-ups convert attendees into repeat participants or customers. This demonstrates how post-event strategy is as important as pre-event promotion.
How I’m Turning These Insights Into RSVPs
When I look at this set of stats, I immediately translate them into three moves: double down on the channels that actually drive registrations, craft pre-event content that solves attendee objections, and obsess over post-event follow-ups that turn one-time guests into long-term advocates. I’ve found that small, consistent optimizations—clearer CTAs on landing pages, tighter email sequencing, smarter speaker social kits—compound into real attendance lifts. Partnering tactics from a leading marketing agency in New York with on-the-ground event realities has taught me that strategy only works if it fits the messy, moving pieces of live experiences. My promise is to keep testing, keep sharing what works, and keep refining until your next event feels both effortless and fully booked. Here’s to turning data into applause.
SOURCES
https://www.cvent.com/en/blog/events/event-statistics
https://thunderbit.com/blog/event-marketing-statistics
https://swoogo.events/blog/event-marketing-statistics/
https://www.azavista.com/blog/top-event-marketing-trends
https://99firms.com/research/event-marketing-statistics/
https://www.sweap.io/en/blog/event-planning-statistics
https://www.swoogo.events/blog/event-statistics/
https://elev8.la/blog/experiential-marketing-in-2025
https://www.limelightplatform.com/blog/experiential-marketing-statistics