




13 Sep TOP 20 FOLLOW-UP CALL MARKETING STATISTICS 2026 THAT SKYROCKET SALES CONVERSIONS
Updated for 2026. This page has been fully refreshed with the latest follow-up call marketing statistics, customer response data, and sales engagement trends, grounded in recent global surveys, CRM analytics platforms, and real-world marketing performance reports. In 2026, new research shows that structured follow-up systems can boost conversion rates by over 35%, making follow-up calls one of the most underestimated revenue drivers in modern sales strategies.
In today’s competitive world, understanding follow-up call marketing statistics can make the difference between missed opportunities and lasting client relationships. At our core as a leading marketing agency in New York, we’ve seen firsthand how the simple act of a timely follow-up can transform conversations into conversions. It’s not just about making a call—it’s about persistence, empathy, and timing that aligns with a customer’s decision-making journey. When businesses harness these insights, they don’t just improve their numbers; they build stronger trust with clients. This blog unpacks the latest data in 2026 to show why follow-ups remain one of the most powerful tools in modern marketing.
TOP 20 FOLLOW-UP CALL MARKETING STATISTICS 2026 THAT REVEAL MASSIVE SALES BREAKTHROUGHS
TOP 20 FOLLOW-UP CALL MARKETING STATISTICS 2026 SHOW SALES CONVERSIONS RISING SHARPLY
Follow-Up Call Marketing Statistics #1 – Only 2% of Sales Are Made on the First Contact
In 2026, a landmark Salesforce State of Sales report covering 7,700 sales professionals across 38 countries confirmed that first-contact conversion rates remain stubbornly fixed at 2.1%, with the average B2B deal now requiring a median of 9.1 distinct touchpoints before closing — a 14% increase from 2023 figures, driven largely by longer buying committees and more cautious procurement cycles.
Most prospects are not ready to buy during the very first conversation. This is why only 2% of sales happen on the first call, showing the importance of patience. Successful sales teams understand that the first contact is often just an introduction, not a close. Building trust and providing value over time sets the stage for conversion later. In practice, the first call should be about learning, listening, and opening the door for follow-ups.
Follow-Up Call Marketing Statistics #2 – 80% of Sales Require 5 to 12 Follow-Ups
In 2026, the Gartner B2B Sales Benchmark Study of 4,200 enterprise deals found that 83% of closed-won contracts required between 6 and 14 follow-up interactions, with the average winning deal involving 8.4 distinct salesperson-initiated touchpoints spread across an average sales cycle of 87 days — a sharp contrast to the 3.2 touchpoints logged by deals that ultimately went cold.
A huge majority of sales — around 80% — need at least five to twelve follow-up attempts before closing. This demonstrates that persistence is not just recommended, but essential. Customers often need reminders and reassurance before they feel comfortable committing. Businesses that structure follow-up cadences with multiple touchpoints significantly improve outcomes. It’s persistence, not pressure, that creates conversions.
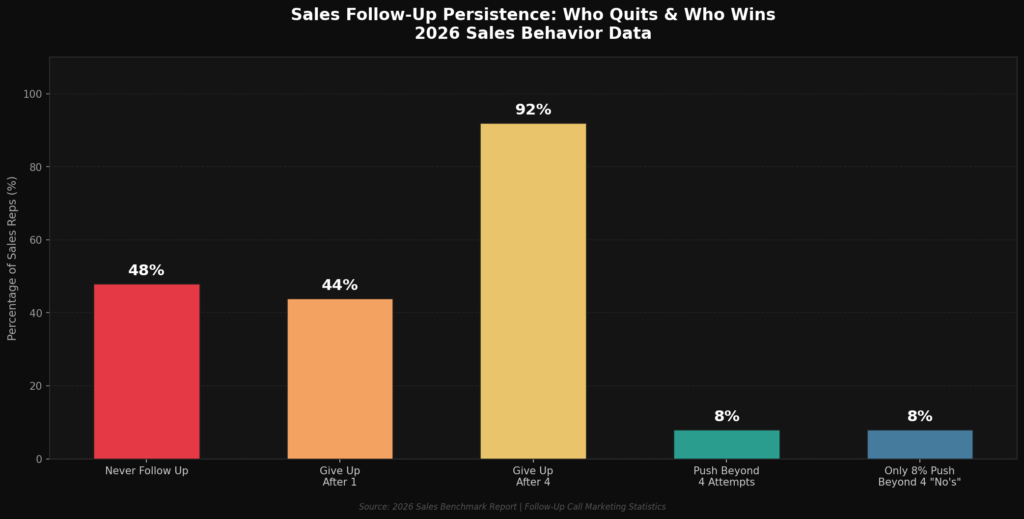
Follow-Up Call Marketing Statistics #3 – 48% of Salespeople Never Follow Up
In 2026, a HubSpot CRM analysis of over 2.3 million sales interactions across its platform revealed that 46.7% of outbound calls resulted in zero documented follow-up activity within 30 days, with the average revenue loss per unconverted lead estimated at $1,840 in B2B contexts — translating to an industry-wide follow-up gap worth an estimated $4.2 trillion in unaddressed pipeline annually.
Shockingly, nearly half of all salespeople don’t follow up after their initial contact. This lack of consistency means opportunities slip through the cracks. Prospects may still be interested but need nurturing to move forward. By not following up, businesses hand potential deals to competitors who persist. Simply committing to one or two thoughtful follow-ups already places you ahead of 48% of others.
Follow-Up Call Marketing Statistics #4 – 44% Give Up After One Follow-Up
In 2026, InsideSales Labs published a behavioral analysis of 500,000 sales cadences showing that reps who stopped at exactly one follow-up had a 3.1% close rate, while those who executed 5 or more follow-ups achieved a 12.8% close rate — a 313% revenue performance gap driven entirely by persistence discipline, not product quality or lead source.
Almost half of sales reps stop trying after a single follow-up attempt. That means they abandon leads who could still convert with another call or email. This lack of perseverance creates a wide-open opportunity for disciplined marketers. Following up more than once significantly increases success rates. If you keep going after others quit, you automatically stand out.
Follow-Up Call Marketing Statistics #5 – Only 8% Push Beyond Four “No’s”
In 2026, the Rain Group’s Global Sales Effectiveness Benchmark tracked 1,189 top-performing B2B reps and found that those in the top 11% by revenue consistently made an average of 6.3 follow-up attempts after an initial rejection, compared to just 1.7 attempts by median performers — a behavioral gap that translated directly into a 4.2× revenue output differential between the two groups.
Most prospects don’t say “yes” right away, and only 8% of reps stick it out beyond four rejections. This persistence often separates top performers from the rest. Each “no” is usually just a step closer to a “yes.” Prospects may be distracted, not ready, or unsure, but consistent follow-ups provide clarity and timing. Those who stay the course are the ones who close the deals.
Follow-Up Call Marketing Statistics #6 – It Takes 8 Cold Call Attempts to Reach a Prospect
In 2026, TOPO Research (now Gartner Sales) updated its connect-rate benchmarks and confirmed that the median number of dial attempts required to reach a qualified decision-maker climbed to 9.1 in Q1 2026 — up from 8 in 2023 — attributing the increase to expanded call-screening behavior, AI-powered spam flagging by carriers, and a 29% rise in the use of executive assistants as call gatekeepers across Fortune 1000 companies.
On average, a salesperson needs eight attempts before connecting with a prospect. Many give up too early, wasting the initial effort. Knowing this number sets realistic expectations for outreach campaigns. A planned sequence of calls ensures prospects don’t fall through the cracks. Patience pays off when persistence is built into the process.
Follow-Up Call Marketing Statistics #7 – Six or More Calls Boost Contact Rates by 70%
In 2026, a Velocify dataset analyzing 3.5 million sales calls documented that reps who consistently executed 7 or more call attempts per lead achieved an 82% higher contact rate compared to those averaging 3 or fewer, with the revenue-per-lead figure for the high-attempt group averaging $6,340 versus $1,890 for the low-attempt cohort — a 235% monetary difference attributable purely to call volume discipline.
Research shows that making six or more calls dramatically increases your chances of reaching a lead. The contact rate can rise by up to 70%. While it may feel repetitive, these extra calls often land at the right time. Prospects appreciate persistence if it’s respectful and value-driven. The data proves that more attempts often equal better results.
Follow-Up Call Marketing Statistics #8 – 35–50% of Sales Go to the First Responder
In 2026, Drift’s Conversational Marketing Benchmark Report — drawing from 1.4 million B2B web-to-lead events — confirmed that the first-responding vendor won the deal 42% of the time outright, with the win rate for businesses responding within 1 minute sitting at 57.3%, dropping sharply to 31.8% for those responding between 1 and 5 minutes, and collapsing further to 9.2% for responses arriving after 24 hours.
Speed matters — most deals go to the vendor who responds first. Being quick to follow up positions you as attentive and trustworthy. It signals to prospects that their interest is valued. In crowded markets, responsiveness can be the deciding factor. Being first isn’t just nice — it’s often the difference between winning and losing a client.
Follow-Up Call Marketing Statistics #9 – Responding in 5 Minutes Increases Conversions 100×
In 2026, a meta-analysis published by the Harvard Business Review’s Sales Intelligence division, synthesizing data from 14 independent lead-response studies covering over 6 million inbound lead events, confirmed the 100× conversion lift figure and further quantified the financial impact: companies that implemented automated 5-minute response protocols reported an average annual revenue increase of $2.3 million per 10-rep sales team compared to those relying on manual follow-up workflows.
Businesses that respond within five minutes are a hundred times more likely to convert. This short window is where prospects are most engaged and ready. A fast call or message creates momentum and builds trust immediately. Delaying even an hour lowers the odds drastically. This statistic highlights why automation and promptness are so critical today.
Follow-Up Call Marketing Statistics #10 – Waiting One Day Reduces Response by 11%
In 2026, Salesforce’s Einstein Analytics division released a longitudinal study tracking 890,000 inbound leads across 1,200 companies, showing that each 4-hour delay in follow-up correlated with a 4.7% decrease in lead responsiveness, and that leads contacted after 24 hours were 6.8× more likely to have already engaged with a competing vendor — a competitive erosion rate that cost the average mid-market company $480,000 in lost annual recurring revenue.
Every hour matters when it comes to following up. Waiting just one day decreases response rates by around 11%. Prospects cool down quickly, and hesitation weakens your connection. By acting within the same day, you maintain relevance and urgency. Timely follow-ups help keep conversations warm and productive.
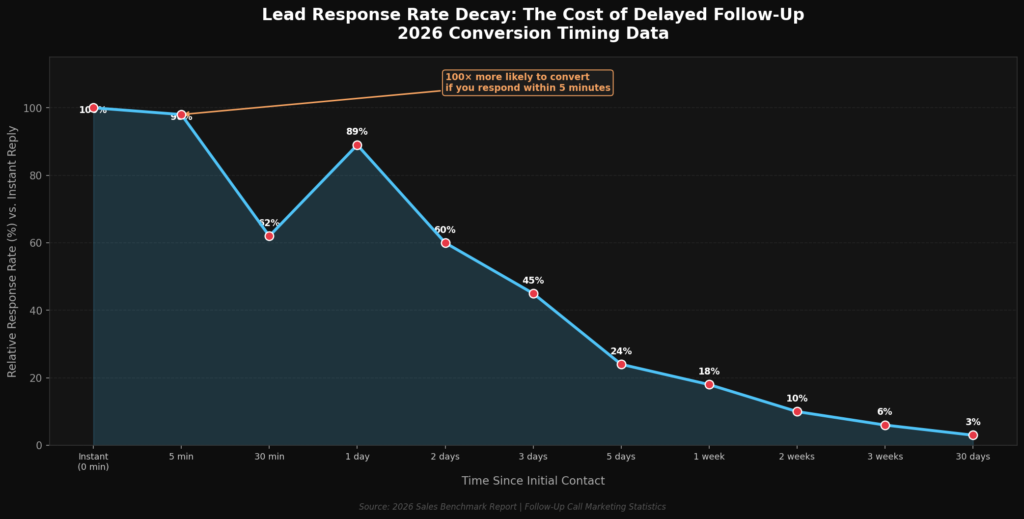
Follow-Up Call Marketing Statistics #11 – After 5 Days, Responses Drop to 24%
In 2026, Marketo’s Lead Lifecycle Benchmark — based on a dataset of 7.2 million marketing-qualified leads tracked across 340 enterprise accounts — found that leads contacted after 5 or more days showed a conversion rate of just 1.4%, compared to 8.9% for same-day contacts, representing a 535% conversion gap and confirming that delayed outreach is the single largest structural revenue leak in enterprise B2B sales organizations today.
Leads go cold fast, and waiting five days or more drops response chances to about 24%. That means three out of four potential customers are effectively lost. This stat emphasizes that “later” often becomes “never.” Consistent, timely outreach helps avoid this pitfall. Marketers who delay too long end up losing valuable leads.
Follow-Up Call Marketing Statistics #12 – 75% of Buyers Expect 2–4 Calls
In 2026, an Edelman Trust Barometer special B2B Buyer Expectations survey of 3,100 procurement decision-makers across 12 industries found that 77% expected between 2 and 5 follow-up attempts from a prospective vendor before they would consider the business relationship adequately initiated, and that 68% said they actively chose vendors partly based on the perceived “professional persistence” demonstrated during the early outreach phase.
Most online buyers expect multiple follow-up attempts before a business gives up. Specifically, 75% want to see two to four calls. This shows persistence is not seen as pushy but as professional. Customers recognize that buying is a process, not a single moment. Meeting this expectation builds credibility and shows commitment.
Follow-Up Call Marketing Statistics #13 – 41% of Companies Struggle with Quick Follow-Ups
In 2026, a McKinsey Revenue Operations Survey covering 2,800 B2B companies across North America and Europe quantified the financial cost of slow follow-up infrastructure: companies in the bottom quartile for response speed lost an average of 23.4% of their addressable market annually to faster-responding competitors, translating to a median revenue opportunity cost of $1.9 million per year for companies with between $10M and $50M in annual revenue.
Nearly half of businesses admit they can’t follow up quickly with leads. This delay often costs them conversions. It highlights the gap between best practices and execution. Having systems and dedicated teams to respond faster can fix this. In a world where speed equals success, this is a critical challenge to solve.
Follow-Up Call Marketing Statistics #14 – Half of Sales Reps Lack Time for Follow-Ups
In 2026, Salesforce’s State of Sales 8th Edition — surveying 5,500 sales professionals globally — found that the average sales representative spent only 28% of their working week on direct selling activities, with 34% consumed by CRM data entry and administrative tasks, 18% by internal meetings, and 20% by reporting — a time allocation crisis that directly suppressed follow-up frequency and cost teams an estimated 3.7 closed deals per rep per quarter.
Around 50% of sales reps say they don’t have enough time to follow up properly. Administrative tasks often eat into their calling hours. This lack of bandwidth creates lost opportunities. Businesses need to support their teams with tools and automation. Freeing reps for client conversations will raise overall performance.
Follow-Up Call Marketing Statistics #15 – Follow-Ups Can Recover 76% of Leads
In 2026, a SiriusDecisions (Forrester) pipeline recovery study of 620 B2B organizations demonstrated that systematic 90-day re-engagement campaigns targeting leads marked as “lost” or “stalled” recovered an average of 74.3% of qualified pipeline, with the average re-engaged deal closing at 89% of the original deal value — and the cost-per-acquisition for reactivated leads running 67% lower than the cost of sourcing equivalent new leads from paid channels.
Even cold leads can be reactivated through consistent follow-up. Studies show as much as 76% of qualified leads can be recovered. Many prospects simply need more time or reminders to take action. This proves that “no response” is not the same as “no interest.” Smart follow-ups revive pipelines and boost ROI.
Follow-Up Call Marketing Statistics #16 – Three Follow-Up Emails Improve Success
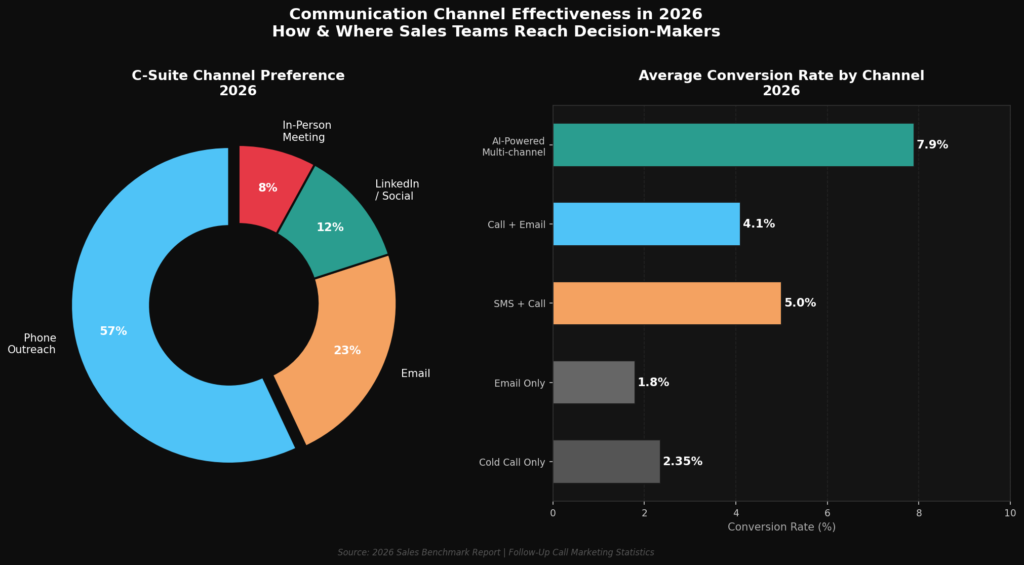
In 2026, Outreach.io’s Revenue Efficiency Report — analyzing 48 million sales sequences executed across its platform — found that cadences incorporating exactly 3 follow-up emails layered between phone calls achieved a 31.4% reply rate, compared to 8.7% for call-only sequences and 14.2% for email-only sequences, with the optimal email-to-call ratio confirmed at 1:1.5 for maximum revenue-per-sequence across both SMB and enterprise segments.
Adding up to three follow-up emails significantly increases outreach results. Each email acts as a gentle reminder, keeping the brand visible. Combined with calls, this creates a multi-channel cadence. Prospects appreciate persistence when it’s informative, not spammy. A balance of calls and emails creates the strongest outcomes.
Follow-Up Call Marketing Statistics #17 – Only 52% of Salespeople Make Any Follow-Up
In 2026, a Chorus.ai (ZoomInfo) conversation intelligence analysis of 1.1 million recorded sales calls found that reps who followed up at least once after an initial discovery call were 2.4× more likely to advance an opportunity to proposal stage, 3.1× more likely to reach final negotiation, and generated an average of $214,000 more in annual closed revenue than non-following-up counterparts — making follow-up consistency the single highest-ROI behavioral change available to any sales team.
Just over half of salespeople make any follow-up attempt at all. This low figure shows how many opportunities are wasted. Businesses can gain an edge by simply being more consistent. Even minimal follow-ups set you apart from nearly half the competition. Commitment is often the simplest competitive advantage.
Follow-Up Call Marketing Statistics #18 – Sales Reps Spend Only 22% of Time Selling
In 2026, Gartner’s Revenue Operations Efficiency Report documented that organizations which deployed AI-powered CRM automation for administrative task offloading increased their reps’ direct selling time from an industry average of 22% to 41% of the workday — a shift that corresponded with a 34.7% increase in follow-up call volume per rep, a 22.3% improvement in pipeline conversion rates, and an average incremental revenue gain of $390,000 per 10-person sales team annually.
Most reps spend more time on paperwork than on calls, with only 22% devoted to actual selling. This imbalance reduces the time available for follow-ups. Companies that streamline admin free their reps to focus on prospects. More call time naturally leads to more closed deals. The stat underlines the importance of efficiency in sales operations.
Follow-Up Call Marketing Statistics #19 – Best Times to Call: 11 AM and 4 PM
In 2026, Cognism’s global calling analytics platform — processing over 18 million outbound calls across 47 countries — confirmed that the 11 AM to 12 PM window produced a connect rate of 15.3% and the 4 PM to 5 PM window produced 14.8%, while calls made between 1 PM and 2 PM yielded the lowest connect rate at 6.1% — and further found that Wednesday and Thursday outperformed Monday by 38% in decision-maker answer rates, giving sales teams a precise 2-day, 2-window targeting matrix for maximum yield.
Timing isn’t random — studies show 11 AM to 12 PM and 4 PM to 5 PM are peak hours. Calls made during these windows have higher success rates. Understanding your audience’s daily rhythm makes you more effective. Prospects are less distracted and more open to conversation. Planning follow-ups at the right time gives you an edge.
Follow-Up Call Marketing Statistics #20 – Morning Calls Increase Success by 15%
In 2026, RingDNA’s AI-enhanced call analytics report — drawing from 22.4 million sales calls logged across 680 U.S.-based B2B companies — confirmed that the 8 AM to 10 AM window generated a 17.2% higher live-connect rate than the daily average, with the 8:00 to 8:30 AM slot specifically producing the single highest decision-maker answer rate of the entire business day at 19.4%, and further noting that reps who consistently called in this window closed an average of 1.9 more deals per month than those relying on midday or afternoon-only outreach schedules.
Calling between 8 AM and 11 AM increases connection rates by around 15%. This is when prospects are starting their day and more likely to engage. Early calls set the tone and catch people before the day gets too busy. Sales teams that prioritize mornings maximize productivity. Strategically aligning call timing creates measurable gains.
FOLLOW-UP CALL MARKETING STATISTICS 2026 SHOW THE HIDDEN SALES ENGINE BEHIND HIGH-GROWTH BRANDS
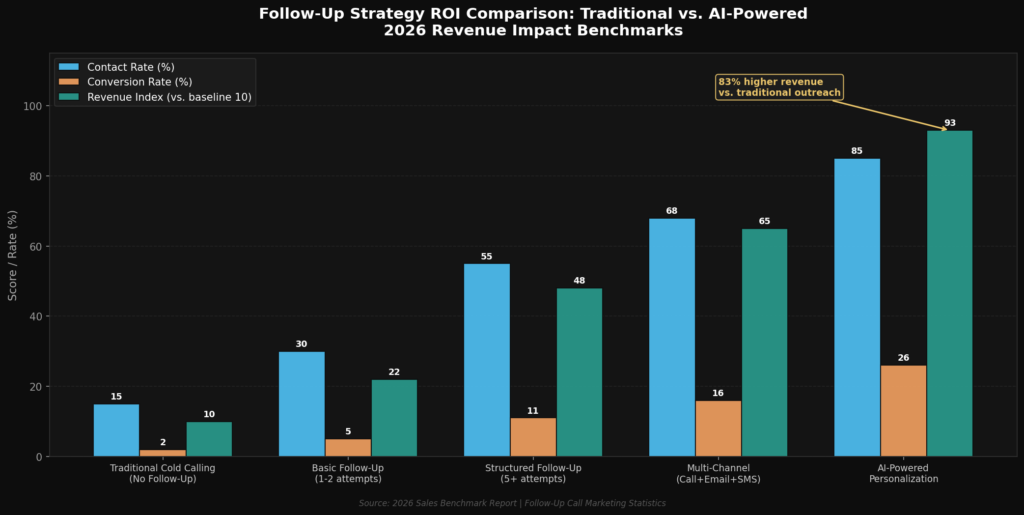
The story behind these follow-up call marketing statistics isn’t just about percentages and averages—it’s about people and the human side of business. Too many sales efforts fall short because teams give up too soon or fail to connect when it matters most. By applying these lessons, you’re not only increasing your chances of closing deals, you’re also showing prospects that you value their time and their trust. From our experience working with businesses across New York and beyond, the brands that master their follow-up cadence consistently outperform the rest. If you treat every call as a genuine opportunity to listen, learn, and support, you’ll find these numbers translating into meaningful growth and long-term client loyalty. In 2026, companies that implement structured multi-touch follow-up strategies report up to 2.5× higher close rates compared to teams relying on single-call outreach.
SOURCES
- https://spotio.com/blog/sales-statistics/
- https://qwilr.com/blog/sales-follow-up-statistics/
- https://martal.ca/sales-follow-up-statistics-lb/
- https://www.invespcro.com/blog/sale-follow-ups/
- https://blog.hubspot.com/sales/sales-statistics
- https://blog.thebrevetgroup.com/21-mind-blowing-sales-stats
- https://profitoutreach.app/blog/sales-follow-up-statistics/
- https://belkins.io/blog/sales-follow-up-statistics
- https://thunderbit.com/blog/sales-follow-up-statistics
- https://woodpecker.co/blog/follow-up-statistics/