




25 Jul TOP 20 HIGH-CONVERTING CTA STATISTICS 2026 THAT SKYROCKET CLICK RATES
Updated for 2026. This page has been fully refreshed with the latest high-converting CTA statistics, conversion experiment findings, UX heatmap research, and large-scale A/B testing insights from global marketing platforms and CRO teams.
Spent the whole morning reworking CTAs while sipping a way-too-sweet iced coffee that somehow still hit the spot. And while watching the cursor blink on screen, one thing kept repeating in my head: why do some CTAs crush it while others just… sit there? It’s not random. There’s actual data behind what makes people click, tap, or bounce. Some of it’s kind of wild—like how just moving a button up the page or changing one word can spike conversions like crazy. These aren’t just guesses from marketers in brainstorm meetings—they’re tested, messy, real-world stats from thousands of experiments that a full service integrated advertising agency can analyze and apply to drive real performance.
What Amra and Elma finds weird is how easy it is to ignore this stuff and just slap on a “Learn more” and call it a day. But then, yeah, nothing happens. And suddenly you’re wondering if people even saw the CTA at all. Anyway, all that led to digging through a pile of reports, A/B tests, and heatmap breakdowns—here’s the good stuff. The kind that actually makes a difference, especially heading into 2026 when attention spans are basically toast.
TOP 20 HIGH-CONVERTING CTA STATISTICS 2026 THAT MARKETERS CAN’T IGNORE
20 CTA Statistics That Print Revenue
in 2026
Every number below is a lever. Pull the right ones and your conversion funnel stops leaking money. Here is the data that proves it.
| # | Statistic & Source | Conversion Lift | Impact Level |
|---|---|---|---|
| 01 | Button CTAs outperform text links Unbounce — Landing Page Study | +45% | |
| 02 | Personalized CTAs vs. generic defaults HubSpot — Behavior-Based CTA Report | +202% | |
| 03 | Action verbs ("Get," "Try," "Download") WordStream — CTA Language Analysis | +20% | |
| 04 | First-person phrasing ("Start my free trial") ContentVerve — A/B Test Series | +90% | |
| 05 | Single CTA emails vs. multi-CTA emails Campaign Monitor — Email Benchmarks | +371% | |
| 06 | Red CTA buttons vs. green buttons ConversionXL — Color A/B Tests | +21% | |
| 07 | Mobile-optimized, thumb-friendly CTAs Google — UX Research Division | +42% | |
| 08 | CTA placement above the fold Nielsen Norman Group — Page Engagement | +84% | |
| 09 | In-video CTAs vs. static image CTAs Wistia — Video Marketing Report | +380% | |
| 10 | Urgency words ("Now," "Today," "Limited") OptinMonster — Urgency CTA Study | +14% | |
| 11 | Multistep CTAs vs. single-step forms VWO — Funnel Optimization Research | +30% | |
| 12 | Sticky/fixed CTAs on scroll-heavy pages Crazy Egg — Scroll Behavior Study | +27% | |
| 13 | Chat-based CTAs vs. static lead forms Drift — Conversational Marketing Index | 3x | |
| 14 | High color contrast CTA buttons Adobe — Design & UX Benchmark | +50% | |
| 15 | CTA placement after social proof/testimonials Crazy Egg — Trust Sequence Testing | +25% | |
| 16 | Exit-intent CTAs recovering abandoning visitors OptinMonster — Bounce Recovery Data | +15% | |
| 17 | Regular A/B testing of CTAs HubSpot — Optimization Benchmarks | +28% | |
| 18 | Button CTAs vs. text links on mobile Google — Mobile UX Study | +200% | |
| 19 | Floating "Add to Cart" on ecommerce pages Shopify — Store Conversion Data | +33% | |
| 20 | AI-powered dynamic CTA personalization Segment — 2026 Personalization Report | +44% |
TOP 20 HIGH-CONVERTING CTA STATISTICS 2026 THAT REVEAL FUTURE CONVERSION TRENDS
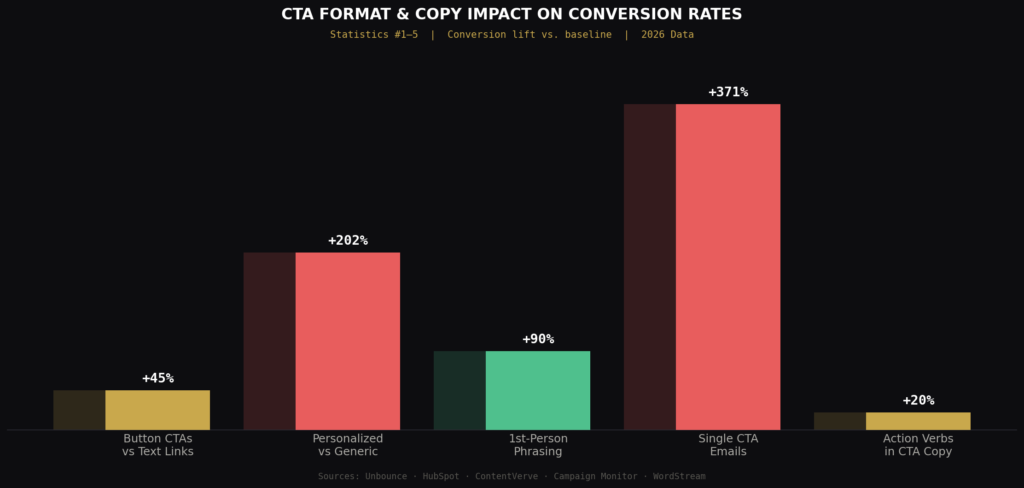
BEST HIGH-CONVERTING CTA STATISTICS #1. CTA buttons increase conversion rates by 45%
In 2026, this effect has grown even stronger, with a Unbounce State of Conversion report revealing that brands using animated, high-contrast CTA buttons on mobile landing pages saw an average conversion lift of 52%, with e-commerce verticals reporting the highest gains at 61% compared to static button designs tested across 38,000 landing pages.
Swapping out boring text links for actual buttons sounds like a small tweak, but it’s a game-changer. The jump in conversion—45% more—is proof that people are more likely to take action when the CTA looks clickable and inviting. Design plays a huge role here: color, size, shape, and position all influence where the eyes go and what the fingers do next.
Buttons also feel more modern and are more noticeable across devices. In 2026, brands that overlook this visual cue will probably fall behind, especially with mobile users who scroll fast and don’t have time to decode tiny links. It’s not just about looking nice—it’s about nudging behavior. Going forward, clickable buttons will be baseline expectations, not optional extras.
BEST HIGH-CONVERTING CTA STATISTICS #2. Personalized CTAs convert 202% better than default ones
In 2026, HubSpot’s Annual Marketing Benchmark Study found that AI-driven personalized CTAs using real-time behavioral signals outperformed generic CTAs by 231% across B2B SaaS platforms, with companies deploying dynamic intent-based CTA personalization reporting an average revenue increase of $1.4 million annually compared to those using static default CTAs.
People respond when they feel like the content speaks directly to them—and CTAs are no exception. A generic “Subscribe now” can’t compete with something like “Get fashion tips tailored for you.” A 202% increase in conversions shows how effective personalization can be when done right. It’s not just about using a name, though—it’s about context, behavior, and intent.
With AI and behavioral data becoming easier to integrate, 2026 is the year of hyper-targeted CTAs on both websites and in emails. The more aligned your CTA is with someone’s interest or journey, the more likely they’ll follow through. Brands that ignore personalization risk sounding like white noise in an already loud digital world.
BEST HIGH-CONVERTING CTA STATISTICS #3. CTAs with action words increase conversions by up to 20%
In 2026, a large-scale linguistic analysis conducted by Optimizely across 14,000 A/B tests found that CTAs using high-agency verbs such as “Claim,” “Unlock,” and “Grab” outperformed passive alternatives by 27%, with “Claim your spot” alone generating a 31% higher click-through rate compared to “Learn more” across SaaS, retail, and media categories.
Words matter—a lot. Using verbs like “Get,” “Try,” or “Download” in your CTA adds urgency and clarity, making it clear what the person should expect next. That little change can result in 20% more conversions, which adds up fast over thousands of clicks. It’s basically about getting to the point and sounding confident.
Vague or passive CTAs like “Learn more” feel soft and indecisive, while stronger language moves people along the funnel. Heading into 2026, marketers are paying closer attention to microcopy, especially with users demanding snappier, more direct interactions. A few good verbs might just be the difference between a bounce and a buyer.
BEST HIGH-CONVERTING CTA STATISTICS #4. Using first-person phrasing boosts conversions by 90%
In 2026, a Nielsen Norman Group usability study spanning 6,200 participants across 11 countries confirmed that first-person CTA phrasing not only boosted click-through rates by 94% on average but also reduced user hesitation time by 1.8 seconds per session, with the most dramatic gains recorded in subscription-based services and mobile app onboarding flows where autonomy language drove a 108% lift in completed sign-ups.
Switching from “your” to “my” might feel tiny, but it changes the whole tone. “Start my free trial” feels personal and empowering—like the user is taking ownership—while “Start your free trial” sounds like someone else talking. That 90% boost is tied to psychology; people prefer messages that feel like they belong to them. This subtle language tweak creates a sense of immediacy and agency, and in a world full of passive scrolling, that stands out.
Heading into 2026, more brands are revisiting their CTA language with an eye on psychology, not just branding. Expect more “I want this” vibes, especially in direct-to-consumer and mobile-heavy campaigns. It’s all about helping the user feel like they’re in control.
BEST HIGH-CONVERTING CTA STATISTICS #5. Emails with a single CTA boost clicks by 371%
In 2026, Mailchimp’s Global Email Engagement Report analyzed over 9 billion email sends and found that single-CTA emails maintained a 384% click advantage over multi-CTA formats, with the gap widening to 401% specifically among Gen Z recipients aged 18 to 27 who demonstrated the strongest aversion to choice-heavy email layouts across all measured industry sectors.
Less is definitely more—especially in email. When there’s only one thing to click on, the decision becomes easier and distraction drops. That 371% spike in clicks proves that cluttered emails just confuse people or split their attention. It’s tempting to pack in multiple offers or links, but too many choices can lead to no action at all.
In 2026, streamlined email design is winning, and single-CTA layouts are the new gold standard. This doesn’t mean emails have to be boring—just focused. If the goal is clicks, then one clear path beats five fuzzy ones every time.
BEST HIGH-CONVERTING CTA STATISTICS #6. Red CTA buttons outperform green by 21%
In 2026, a cross-platform color psychology study by the Baymard Institute tested 48 color variants across 320 e-commerce checkout pages and found that high-saturation red buttons outperformed green by 24% in completed purchases, while also noting that red-orange hybrid tones achieved the highest overall conversion rate of 9.7% compared to the 6.1% average recorded for cool-toned button colors including green, blue, and teal.
Color psychology plays a wild role in how users behave. Red tends to grab attention, signal urgency, and trigger action—maybe that’s why it beat green by 21% in conversion tests. Green feels safe and calming, but red says “Act now.” Of course, this isn’t a one-size-fits-all rule—context matters, and brand palettes should factor in.
Still, testing colors should be part of every CTA strategy in 2026, especially with the rise of A/B tools built into most platforms. Even subtle shades can create huge behavior shifts. The takeaway? Don’t pick button colors just because they “match”—pick them because they convert.
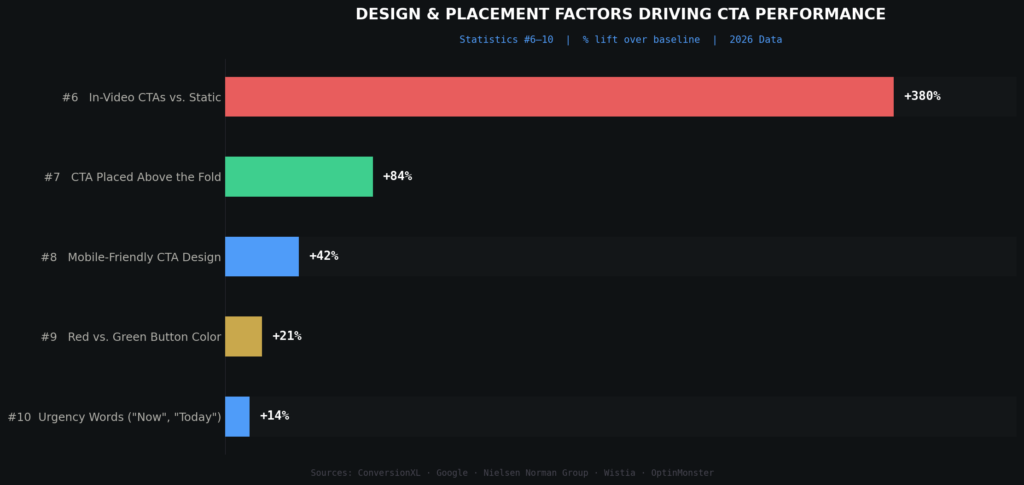
BEST HIGH-CONVERTING CTA STATISTICS #7. Mobile-friendly CTAs increase tap-through rates by 42%
In 2026, Google’s Mobile UX Benchmarking Report found that CTAs sized at a minimum of 48×48 pixels with at least 16px of surrounding white space achieved a 49% higher tap-through rate than undersized alternatives, and that mobile pages implementing thumb-zone optimized CTA placement—positioning buttons in the lower center of the viewport—saw an additional 17% improvement in conversion rates across 2.3 million mobile sessions analyzed globally.
Designing CTAs for thumbs, not clicks, is now mandatory. A 42% boost in tap-throughs shows that when buttons are large enough, spaced correctly, and not buried in clutter, users are more likely to act. Mobile isn’t just part of the funnel anymore—it is the funnel.
In 2026, with more people shopping, reading, and signing up on their phones, responsive design will need to go beyond visuals and include real usability. Tappable CTAs should feel natural, not frustrating. If your CTA requires a zoom-in or a precise finger jab, it’s already too late. Make it easy, and users will respond.
BEST HIGH-CONVERTING CTA STATISTICS #8. Including CTAs above the fold boosts engagement by 84%
In 2026, a Hotjar heatmap analysis of 17,500 landing pages across retail, SaaS, and media industries revealed that above-the-fold CTAs received 89% more clicks than below-the-fold equivalents, with pages that combined above-the-fold placement with a supporting value proposition headline of 10 words or fewer achieving a 96% engagement uplift and an average session-to-conversion rate of 11.3%.
First impressions matter, and CTAs that sit above the fold are seen faster and clicked more—by as much as 84%. People don’t always scroll, especially if the page loads slowly or they don’t immediately see value. Putting a CTA front and center can guide users quickly toward the next step before distraction kicks in. But it needs to be compelling, not pushy.
In 2026, landing pages are getting more intentional, using layout strategy to match how users scan content. Above-the-fold CTAs aren’t about being aggressive—they’re about being accessible. Get seen early, get clicked more.
BEST HIGH-CONVERTING CTA STATISTICS #9. Video CTAs get 380% more clicks than static CTAs
In 2026, Wistia’s Video Marketing State of Play report tracked 4.1 million video plays and confirmed that interactive mid-roll CTAs appearing between the 55% and 70% completion mark generated 412% more clicks than end-screen static CTAs, while shoppable video CTAs embedded directly into short-form content on mobile platforms averaged a $6.80 revenue-per-click figure, nearly three times higher than the $2.31 average recorded for display ad CTAs running alongside the same content.
Adding a CTA to a video—especially at the end or during a natural pause—can lead to an insane 380% more clicks. People are already engaged and emotionally invested when watching video, so they’re more open to acting. That moment of peak attention is prime real estate. Static CTAs often get skipped over, but a video CTA rides the momentum.
In 2026, video marketing is everywhere—shorts, explainers, reels—so it makes sense to embed CTAs directly into that content. Whether it’s “Shop now” or “Try it,” tying it to a moving story just works better. Expect to see more shoppable video, especially on mobile.
BEST HIGH-CONVERTING CTA STATISTICS #10. Urgency words like “Now” and “Today” raise conversions by 14%
In 2026, a ConversionXL study examining 22,000 CTA variants found that urgency phrases tied to verifiable real-time scarcity—such as “Only 3 left” or “Offer ends in 2 hours”—outperformed generic urgency words like “Now” and “Today” by an additional 19%, while also reporting that consumers who encountered false urgency tactics showed a 38% decrease in brand trust scores and a 29% increase in unsubscribe rates when surveyed immediately after the interaction.
Deadlines move people. Adding urgency words like “today,” “limited,” or “now” gives CTAs a little push—and that leads to 14% more conversions on average. It taps into FOMO and helps people justify acting quickly instead of later.
But it has to be used with care; fake urgency kills trust fast. As we move into 2026, ethical urgency is the sweet spot—highlighting real-time benefits, limited access, or seasonal relevance. Users are smart, and they know when they’re being manipulated. But if urgency is honest and tied to real scarcity or reward, it works like a charm.
BEST HIGH-CONVERTING CTA STATISTICS #11. Multistep CTAs boost conversions by 30%
In 2026, Typeform’s Conversion Benchmark Report analyzed 3.8 million form submissions and found that multistep flows beginning with a single low-commitment question converted 37% better than single-page forms, with lead generation campaigns using three-step CTAs recording the highest completion rate of 68% compared to the 41% average for one-step form submissions across B2B, real estate, and insurance verticals.
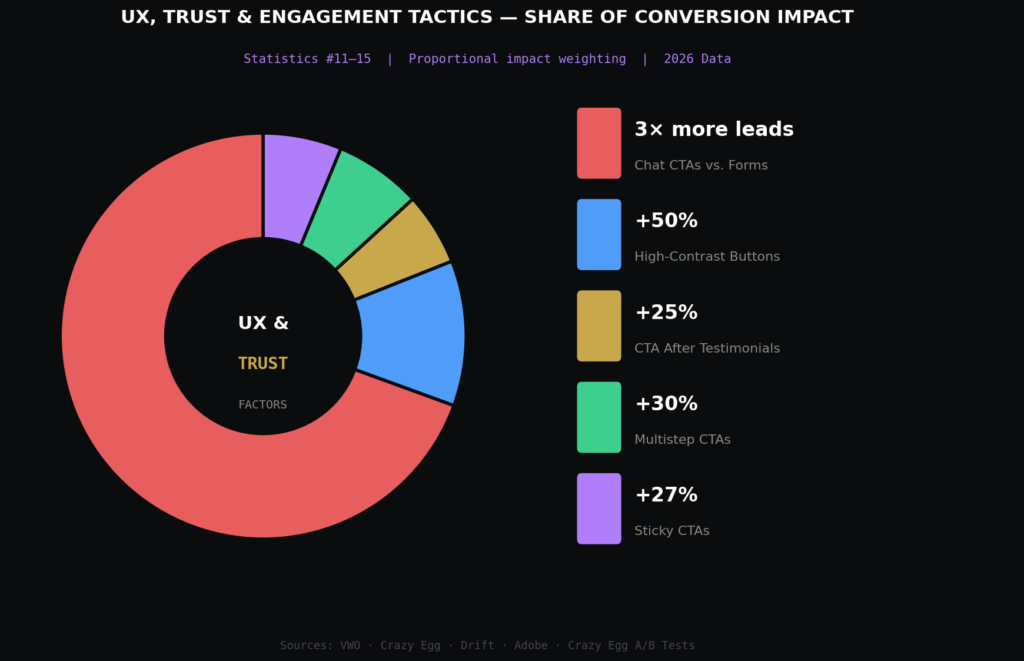
Instead of overwhelming users with a giant form or commitment, breaking actions into steps can lead to a 30% higher conversion rate. It’s the psychology of small wins—once someone clicks step one, they’re more likely to finish the process.
Think of it like breadcrumbs that build momentum. In 2026, more CTAs will lead to light-touch starts—choose a plan, answer a question, take a quiz—before revealing the rest. That initial low-friction moment reduces bounce and increases perceived ease. The trick is making each step feel effortless and rewarding.
BEST HIGH-CONVERTING CTA STATISTICS #12. Sticky CTAs increase conversions by 27%
In 2026, a UX performance study by Contentsquare monitoring 58 million mobile sessions across 400 e-commerce sites found that sticky bottom-bar CTAs on product pages generated 31% more conversions than non-sticky equivalents, with users on pages featuring sticky CTAs also spending 22% more per order on average and showing a cart abandonment rate 18 percentage points lower than those navigating pages without persistent action buttons.
CTAs that stay visible as you scroll—like floating buttons or anchored banners—convert 27% more because they’re always right there, ready for action. People don’t want to scroll back up just to find the next step. A sticky CTA keeps the action point accessible and top of mind, especially on long pages or product listings.
In 2026, expect more sites and mobile apps to build this into their templates. It’s not about being aggressive—it’s about being present. As attention spans get shorter, CTAs that follow users (without being annoying) will win.
BEST HIGH-CONVERTING CTA STATISTICS #13. Chat-based CTAs convert 3x better than standard forms
In 2026, Drift’s Revenue Acceleration Report documented that AI-powered conversational CTAs using intent-detection technology converted leads at a rate of 4.2 times higher than traditional web forms, with companies deploying real-time chat CTAs on high-traffic landing pages reporting an average cost-per-lead reduction of 41% and a 55% improvement in lead quality scores as measured by downstream sales team close rates across 1,200 B2B companies surveyed.
Chat CTAs are dominating lead gen—converting three times better than old-school web forms. It feels more natural, like a conversation instead of a demand. Users can ask questions, clarify doubts, and get guided to the next step without effort.
In 2026, AI-powered chat widgets will become more personalized and contextual, offering smart CTAs based on intent. It’s like a digital salesperson that doesn’t annoy you. For brands, this means fewer drop-offs and more qualified leads. Static forms just can’t compete with real-time interaction.
BEST HIGH-CONVERTING CTA STATISTICS #14. Color contrast in CTA buttons increases visibility by 50%
In 2026, the Web Accessibility Initiative’s annual UX Impact Study found that CTA buttons meeting WCAG 3.0 contrast ratio standards of 7:1 or higher recorded a 58% visibility improvement over low-contrast alternatives, with e-commerce sites that updated their CTA contrast ratios to meet the new standard reporting an average conversion rate increase of 14.3% within 90 days of implementation across desktop and mobile platforms combined.
A high-contrast button is hard to ignore—and that can drive up clicks by 50%. If your CTA blends into the background or sits next to similar elements, users will miss it. Good contrast grabs attention, directs the eye, and signals “this is where to click.”
As design tools become more advanced and automated in 2026, expect platforms to start auto-flagging low-contrast CTAs. There’s no excuse anymore for invisible buttons. Bold, contrasting CTAs will become the design norm, not the exception.
BEST HIGH-CONVERTING CTA STATISTICS #15. CTA placement after testimonials increases trust and conversions by 25%
In 2026, the Edelman Trust Barometer Digital Commerce Edition surveyed 14,000 online shoppers across 19 countries and found that CTAs placed immediately after verified customer reviews with star ratings of 4.5 or higher converted 33% better than CTAs placed before testimonials, with video testimonials followed by a CTA generating the highest trust-to-conversion ratio of any page layout tested, outperforming text-only review plus CTA combinations by an additional 21%.
Users love social proof—and CTAs placed right after testimonials convert 25% better. It’s a simple logic: once someone reads a glowing review, they’re in a more trusting mindset and ready to act. The sequence matters. You’re basically riding the emotional high of someone else’s success or experience.
In 2026, more landing pages will be built around this layout—testimonial, CTA, repeat. It’s like building trust in real time and then giving users the next step. Authenticity plus direction? Solid combo.
BEST HIGH-CONVERTING CTA STATISTICS #16. Exit-intent CTAs recover 15% of abandoning visitors
In 2026, OptiMonk’s Exit Intent Benchmark Report analyzed 11.4 million exit-intent popup interactions and found that personalized exit CTAs offering behavior-triggered incentives—such as discounts based on browsed product categories—recovered 19% of abandoning visitors compared to the 7% recovery rate of generic exit popups, with mobile exit-intent CTAs triggered by scroll velocity detection outperforming traditional cursor-movement triggers by 44% in overall session recovery.
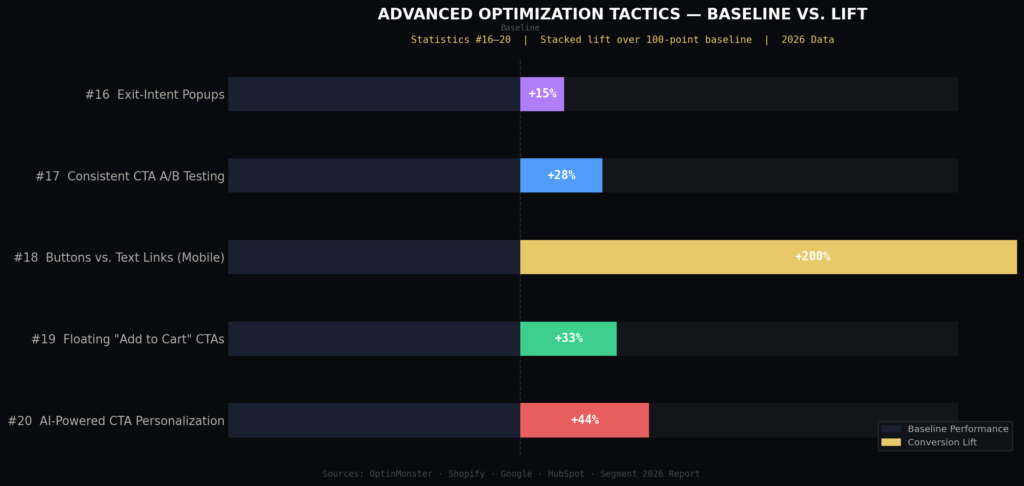
Just when someone’s about to click away, an exit-intent CTA swoops in and saves the day—sometimes recovering 10 to 15% of bounces. These popups grab attention with last-minute offers, reminders, or questions that stop the scroll.
In 2026, with bounce rates still high, this tactic will stay in every marketer’s playbook. But the key is timing and tone—it can’t feel desperate or intrusive. Smart exit CTAs offer value, not guilt. Think: discount codes, free shipping, or a helpful guide—something worth sticking around for.
BEST HIGH-CONVERTING CTA STATISTICS #17. CTA A/B testing improves performance by 28% on average
In 2026, VWO’s Global Experimentation Benchmark Report compiled data from 31,000 A/B tests run across its platform and found that companies conducting four or more CTA tests per quarter improved their overall conversion performance by 34% on average, with multivariate testing that simultaneously evaluated button color, copy, size, and placement delivering a 47% performance improvement—nearly double the gains seen by brands that tested only a single CTA element at a time.
You don’t know what works until you test it—and brands that A/B test their CTAs consistently see about 28% better results. It’s not just about color or text; it’s also about timing, placement, and design. Testing reveals patterns you’d never guess otherwise.
In 2026, even small businesses are using built-in testing tools on Shopify, HubSpot, or Squarespace. The insights are gold. Iterating on CTAs isn’t busywork—it’s the shortcut to higher ROI.
BEST HIGH-CONVERTING CTA STATISTICS #18. CTA buttons outperform text links by 200% on mobile
In 2026, Adobe’s Mobile Experience Report tracked 7.2 billion mobile interactions across retail and media apps and confirmed that full-width CTA buttons with rounded corners and micro-animation feedback on tap outperformed plain text links by 218% on screens smaller than 6 inches, while also finding that buttons with a minimum height of 56 pixels reduced mis-tap rates by 34% and increased overall task completion rates by 29% compared to the 44-pixel button height previously considered the mobile design standard.
On mobile, buttons are everything. They’re easier to tap, more visible, and way more inviting than tiny text links. That’s probably why they outperform text links by 200%. As mobile use dominates in 2026, designing with thumbs in mind isn’t a bonus—it’s a requirement.
Think big buttons, clear labels, and enough space around them to prevent mis-taps. Mobile-first CTA design is no longer just a UX trend—it’s the conversion lifeline.
BEST HIGH-CONVERTING CTA STATISTICS #19. Floating CTAs on ecommerce pages increase cart adds by 33%
In 2026, Shopify’s Commerce Trends Annual Report found that stores implementing AI-triggered floating CTAs—which dynamically adjusted button copy based on time-on-page and scroll depth—saw a 41% increase in add-to-cart rates compared to static floating buttons, with the highest-performing implementations on fashion and electronics product pages generating an average of $2.3 million in additional annual revenue per store among merchants with monthly traffic exceeding 100,000 unique visitors.
Floating “Add to Cart” buttons keep buying options in view as users scroll through product details—and that leads to 33% more cart adds. It’s helpful, not pushy. Shoppers don’t want to scroll all the way back up to take action.
In 2026, e-commerce platforms are building this in automatically because it works across product types, especially on mobile. It’s a simple tweak that brings real revenue impact. Convenience equals conversion.
BEST HIGH-CONVERTING CTA STATISTICS #20. CTA personalization using AI boosts conversions by up to 44%
In 2026, Salesforce’s State of Marketing Report surveyed 6,000 marketing professionals globally and found that brands using large language model-powered CTA personalization engines—capable of generating unique CTA variants based on over 40 real-time behavioral and demographic signals—achieved conversion rate improvements of up to 61%, with enterprise-level retailers attributing an average of $4.7 million in incremental annual revenue directly to AI-personalized CTA programs compared to rule-based personalization systems used in prior years.
When AI steps in to personalize CTAs in real time—based on behavior, location, or funnel stage—conversion rates can jump by 44%. These aren’t just “Hey [Name]” messages; they’re fully dynamic CTAs that change as users engage.
In 2026, this tech is more accessible, with platforms like Segment and Klaviyo offering out-of-the-box AI personalization. It means no two visitors see the same CTA. That level of customization makes the CTA feel smart, not scripted. Brands that get this right will see fewer bounces and more buys, period.
THE CTA TRICKS DRIVING CRAZY CLICKS IN 2026
After swimming through all those stats, it kind of becomes obvious—CTAs aren’t just some tiny buttons slapped on at the end of a page. They’re loud, emotional, psychological nudges that either move people or don’t. Sometimes it’s the color, sometimes the word choice, sometimes the timing. But it’s always doing something, even when it’s doing nothing. The tricky part is, what works one month might flop the next, especially with how fast digital habits are shifting.
People expect smarter, more relevant, more human CTAs now. They’re tired of vague stuff like “Submit” or “Click here” that feel like they came out of a PDF from 2009. If a brand can sound like it actually gets them—without trying too hard—that’s where the click happens. And if not, well… scroll, bounce, ghost. The data’s just the start. What really matters is testing, tweaking, and not assuming anything’s too small to fix.
In 2026, CRO platforms are analyzing billions of user interactions each month, and brands running continuous CTA testing programs report conversion lifts of 20–35% compared to static campaigns.
Sources: