



25 Sep TOP 20 PLUMBER MARKETING STATISTICS 2025
When I started researching plumber marketing statistics, I realized just how much this industry is evolving with digital trends. From local SEO and Google map listings to the growing reliance on customer reviews, plumbers are finding new ways to connect with clients in a competitive market. As someone who’s passionate about understanding how businesses can grow, I wanted to put together the most relevant stats to help guide both seasoned plumbers and those just starting out. In doing so, I also looked at insights from the leading marketing agency in New York, because I know how much expertise matters when turning numbers into actionable strategies. My goal is to share not just the data, but also the story it tells about where plumbing businesses can thrive in 2025 and beyond.
Top 20 Electrician Marketing Statistics 2025 (Editor’s Choice)
🔧 Top 20 Plumber Marketing Statistics 2025
Data-Driven Insights to Supercharge Your Plumbing Business
| # | Statistic | Description | Category |
|---|---|---|---|
| 1 | 97% | Consumers learn about local businesses on the internet over anywhere else | Digital Search |
| 2 | 51% | Customers use mobile searches to discover a new business | Mobile Search |
| 3 | 288% | "Plumbers near me" has shown year-over-year growth as a mobile search term | Local SEO |
| 4 | 93% | Consumers who search for plumbing are most likely to make a call after the search | Conversion |
| 5 | 54% | Customers research plumbing services online before scheduling an appointment | Research |
| 6 | 70%+ | Of clicks come from either Google Maps 3-Pack results or traditional organic results | Local SEO |
| 7 | 76% | People who search on smartphones for a nearby plumber visit or hire that company within 24 hours | Mobile Local |
| 8 | 69% | Smartphone users will purchase from companies that answer queries via mobile website | Mobile UX |
| 9 | 46% | Of all searches have local intent, making local SEO crucial for plumbers | Local Intent |
| 10 | 76% | Consumers who searched for plumbers did not have a specific company in mind | Opportunity |
| 11 | 86% | Customers check reviews before doing business with a local company like plumbers | Reviews |
| 12 | 77% | Customers read online reviews when searching for a local business | Reviews |
| 13 | 68% | Customers are influenced by positive reviews, making them crucial for plumbing businesses | Reputation |
| 14 | 40% | Customers are deterred from businesses because of negative reviews | Reputation |
| 15 | +14% | Boost in conversion rates when businesses respond to online reviews | Engagement |
| 16 | 70% | Plumbing companies working with a marketing agency are dissatisfied with the results | Agency Issues |
| 17 | 300% | More website traffic generated by SEO compared to social media channels for plumbing businesses | SEO ROI |
| 18 | $614 | Average amount consumers spend on plumbing after making a search | Value |
| 19 | +120% | Revenue increase for small businesses that offer online booking | Booking |
| 20 | $36:$1 | Email marketing ROI in the plumbing sector (for every $1 spent) | Email ROI |
Top 20 Plumber Marketing Statistics 2025
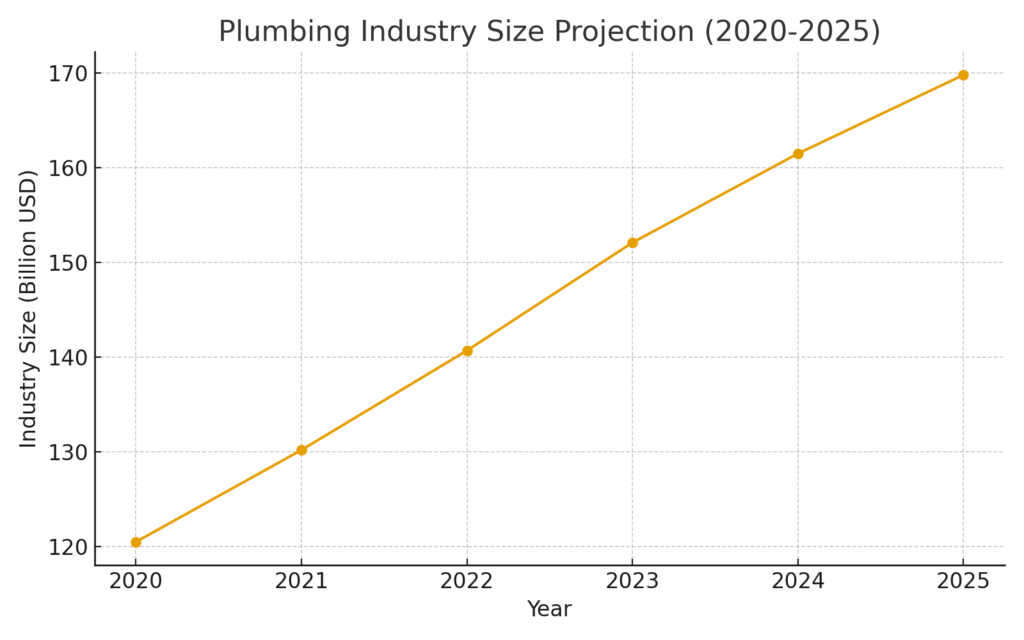
Plumber Marketing Statistics #1 – Plumbing Industry Projected To Reach $169.8 Billion In 2025
The U.S. plumbing industry is projected to hit $169.8 billion by 2025, showing just how much demand continues to grow. This number reflects the importance of plumbers in both residential and commercial markets. It also signals more opportunities for local businesses to invest in marketing and attract a larger share of customers. With such growth, plumbers who ignore digital strategies risk being left behind. Tapping into this expanding market requires strong branding, visibility, and effective customer outreach.
Plumber Marketing Statistics #2 – 132,000 Plumbing Businesses In The U.S.
There are around 132,000 plumbing businesses operating across the United States. This level of competition means standing out online is more important than ever. Simply relying on word-of-mouth is not enough when so many competitors are only a click away. Smart digital marketing gives small and mid-sized plumbing companies the chance to rise above the noise. Investing in SEO, ads, and reviews can make a single plumber more visible in a crowded marketplace.
Plumber Marketing Statistics #3 – 70% Of Plumbers Dissatisfied With Marketing Agencies
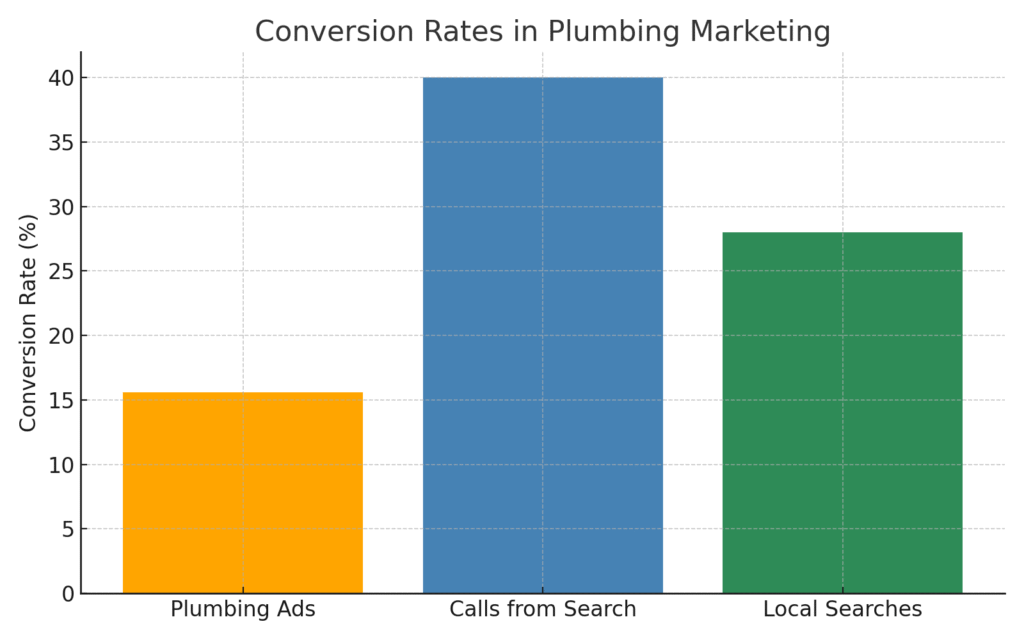
About 70% of plumbers who work with agencies are dissatisfied with the results they get. This shows how common it is for businesses to invest in marketing without seeing real ROI. The problem often comes from cookie-cutter campaigns that don’t reflect the unique needs of local service providers. Plumbers need specialized strategies built around local SEO, reviews, and lead generation. Choosing an experienced partner makes all the difference in turning marketing from a cost into a profit driver.
Plumber Marketing Statistics #4 – 42% Of Local Queries Lead To Map Pack Clicks
Nearly half—42%—of local search queries result in clicks on the Google Map Pack. For plumbers, this is the prime digital real estate where most potential customers decide who to call. Being visible in the Map Pack directly translates into more calls, bookings, and sales. Without it, plumbers risk losing business to competitors who show up in those top spots. Prioritizing local SEO and Google Business Profile optimization is critical for growth.
Plumber Marketing Statistics #5 – Local 3-Pack Gets 44% CTR
The Local 3-Pack, which shows the top three results in Google Maps, gets a massive 44% click-through rate. This statistic highlights the power of ranking high in local searches. For plumbers, appearing here means more than just visibility—it means credibility. Customers often trust Google’s top recommendations, assuming they’re the best in the area. Investing in reviews, citations, and proximity targeting helps plumbers secure these top spots.
Plumber Marketing Statistics #6 – 28% Of Local Searches Lead To A Transaction
About 28% of local searches convert into an actual transaction. For plumbers, this means that almost one in three people searching locally is ready to hire. It’s a powerful reminder that local SEO traffic has much higher intent than generic web traffic. By capturing these ready-to-buy users, plumbers can see faster results from marketing. This makes local SEO one of the most profitable investments in the industry.
Plumber Marketing Statistics #7 – 70% Of Mobile Searches Lead To Map Pack Clicks
A full 70% of mobile users click on Map Pack listings when searching for local services. Since many plumbing needs are urgent, mobile is where customers are making quick decisions. Appearing in this space can be the difference between getting a call or losing the lead. Mobile optimization, fast-loading websites, and mobile-first ads are non-negotiable. Plumbers must meet customers where they are—on their phones.
Plumber Marketing Statistics #8 – 46% Of Google Searches Are Local
Nearly half of all Google searches—46%—are looking for local businesses and services. This shows just how important it is for plumbers to be visible locally. Customers aren’t searching for generic info, they’re looking for “plumber near me” or “emergency plumbing.” Ignoring local SEO means losing access to almost half the search audience. By optimizing properly, plumbers can meet this huge customer demand head-on.
Plumber Marketing Statistics #9 – SEO Drives 300% More Traffic Than Social Media
SEO generates around 300% more traffic compared to social media for plumbers and contractors. While platforms like Facebook or Instagram can help with branding, search engines drive real service bookings. When someone searches “clogged drain repair,” they’re already ready to buy. Social media audiences may not always have that intent. That’s why investing heavily in SEO creates stronger, long-term growth for plumbing businesses.
Plumber Marketing Statistics #10 – Top 5 Organic Results Get 69.1% Of Clicks
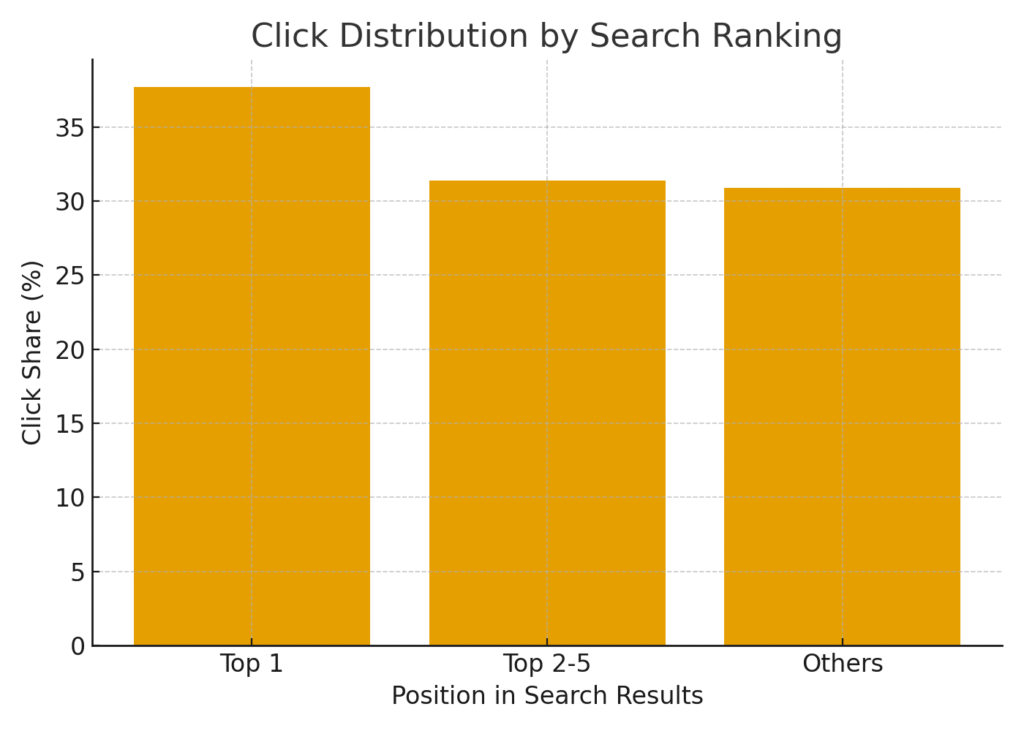
The top five organic search results capture nearly 70% of all clicks. This demonstrates how vital it is for plumbers to rank high on Google. If a plumbing business ranks below this range, they miss out on most of the search traffic. Strong SEO strategies help secure these top spots, delivering more calls and customers. In today’s competitive environment, ranking outside the top 5 almost guarantees invisibility.
Plumber Marketing Statistics #11 – 75% Of Users Never Go Past Page One
About 75% of searchers never click beyond page one of Google. For plumbers, this means that being on page two or three is nearly useless. Customers simply don’t scroll that far when they need fast service. To capture leads, plumbers must focus on ranking on page one through SEO and Google Ads. Otherwise, their websites may as well not exist.
Plumber Marketing Statistics #12 – First Organic Result Gets 37.7% Higher CTR Than First Ad
The first organic result earns a 37.7% higher click-through rate than the first paid ad. This highlights the trust people place in organic rankings. While ads are effective, customers still prefer clicking results that Google “recommends.” For plumbers, this means a dual strategy of SEO and paid ads is best. Combining both ensures maximum visibility across different types of searches.
Plumber Marketing Statistics #13 – Plumbing Ads Have 15.61% Conversion Rate
In the home services industry, plumbing ads have one of the highest conversion rates at about 15.61%. This means that paid ads can be very effective in generating actual business. When done right, Google Ads allow plumbers to appear at the exact moment a customer is ready to book. It’s especially powerful for emergency plumbing services. A well-optimized ad campaign can quickly bring in measurable returns.
Plumber Marketing Statistics #14 – Average CPC For Plumbing Is $9.39
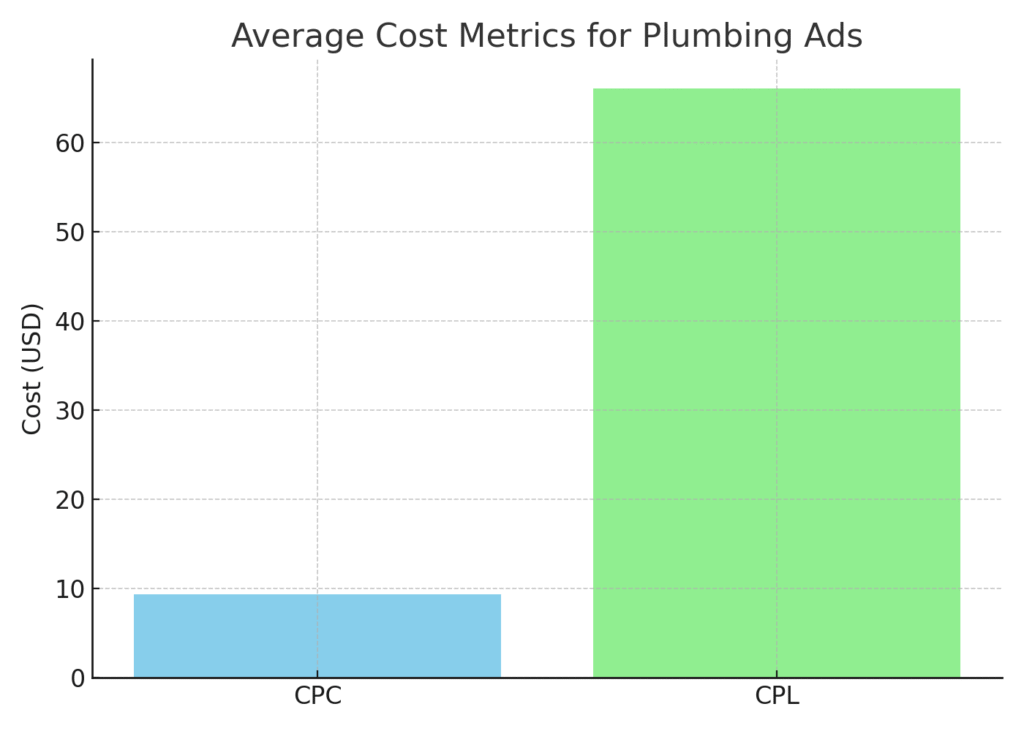
The average cost-per-click for plumbing-related ads is around $9.39. While this might seem high, the return from a booked job usually far outweighs the cost. For example, one plumbing job can generate hundreds of dollars in revenue. Understanding CPC helps plumbers set realistic ad budgets. With proper targeting, the ROI makes these costs worthwhile.
Plumber Marketing Statistics #15 – Average CPL For Search Ads Is $66.02
On average, plumbers pay about $66.02 per lead from search ads. This is a standard cost in the home services space. However, given the high ticket value of plumbing jobs, it’s still profitable. By refining targeting and improving landing pages, plumbers can lower CPL over time. The key is to measure every campaign and adjust continuously.
Plumber Marketing Statistics #16 – 40% Of Search Calls Convert
Roughly 40% of customers who call after searching for a plumber end up booking. This is one of the highest conversion rates across industries. It shows the power of phone calls for local businesses. For plumbers, having a reliable phone line and quick response is crucial. Every missed call is essentially a lost customer.
Plumber Marketing Statistics #17 – Calls Convert 10–15x More Revenue Than Web Leads
Phone calls generate 10 to 15 times more revenue than web leads in home services. This emphasizes the importance of call tracking and management. Customers want immediate answers when dealing with plumbing issues. A fast, professional call response builds trust and wins more jobs. Plumbers should view their phone systems as one of their strongest marketing assets.
Plumber Marketing Statistics #18 – 34% Of Customers Prefer Phone Communication
About one-third of home service customers prefer phone calls as their primary way of reaching a business. Even with digital tools, people still like the reassurance of speaking directly. For plumbers, this is an opportunity to strengthen customer relationships. Friendly, professional calls can set the tone for trust. Emphasizing phone accessibility makes a plumbing business more approachable.
Plumber Marketing Statistics #19 – 83% Of Consumers Read Google Reviews For Local Businesses
A staggering 83% of U.S. consumers rely on Google reviews before hiring a local business. For plumbers, this is a direct reflection of their credibility. Reviews can make or break whether a customer decides to call. Encouraging happy clients to leave feedback is one of the most cost-effective marketing tactics. Positive reviews build trust and improve local rankings at the same time.
Plumber Marketing Statistics #20 – Plumbing Fixtures Market Growing At 7.8% CAGR
The global plumbing fixtures market is growing at a CAGR of 7.8% until at least 2028. This growth indicates continued investment in new construction and renovations. For plumbers, it means ongoing opportunities to expand services. The more homes and buildings invest in modern fixtures, the more demand there is for skilled professionals. This trend underscores the long-term stability of the plumbing industry.
Why These Stats Matter for Every Plumber
Looking through these plumber marketing statistics has been eye-opening for me, because it’s clear that small shifts in online presence can make a huge difference in attracting new customers. Whether it’s investing in SEO to rank higher on Google, encouraging satisfied clients to leave positive reviews, or running smart ad campaigns, these strategies are no longer optional—they’re essential. I’ve personally seen how a well-executed marketing plan can completely transform a local service business, and plumbers have the same opportunity to build lasting growth. As I wrap up, I want to leave you with this thought: the plumbing industry isn’t just about fixing leaks, it’s about building trust and visibility in a digital world. And with the guidance of experts like the leading marketing agency in New York, I truly believe plumbers can tap into these strategies to secure long-term success.
SOURCES
https://www.plumbingwebmasters.com/7-marketing-statistics-for-plumbers/
https://www.plumbingwebmasters.com/plumbing-industry-statistics/
https://www.servicetitan.com/blog/plumbing-industry-statistics
https://www.callrail.com/blog/home-services-marketing-statistics
https://www.invoca.com/blog/home-services-marketing-stats
https://hookagency.com/blog/plumbing-marketing-blueprint/
https://finturf.com/blog/plumbing-marketing/
https://www.getjobber.com/academy/plumbing/plumbing-industry-statistics/
https://www.amraandelma.com/plumbing-marketing-statistics/
https://www.broadly.com/blog/plumbing-marketing/
https://www.localiq.com/blog/home-services-search-advertising-benchmarks/
https://www.webfx.com/blog/home-services/home-services-marketing-benchmarks/
https://www.servicetitan.com/blog/home-services-industry-statistics
https://www.1800plumberfranchise.com/blog/plumbing-industry-trends-and-statistics/