



21 Sep TOP 20 PRIVATE LABEL MARKETING STATISTICS 2025
Exploring the latest private label marketing statistics feels a bit like peeking behind the curtain of how modern shoppers think, spend, and stay loyal to the stores they trust. Over the past few years, private labels have shifted from being seen as just cheaper alternatives to becoming real competitors in terms of quality and innovation. This trend is not only shaping consumer habits but also transforming how retailers approach branding. As someone who loves digging into the stories numbers tell, I find it fascinating to see how even the biggest names adapt when private brands begin to set the pace. If you’re looking for deeper insights on how to position your own brand, working with a marketing agency in New York can give you the kind of perspective that blends local expertise with global market shifts.
Top 20 Financial District Marketing Statistics 2025 (Editor’s Choice)
| Stat # | Private Label Marketing Statistics |
|---|---|
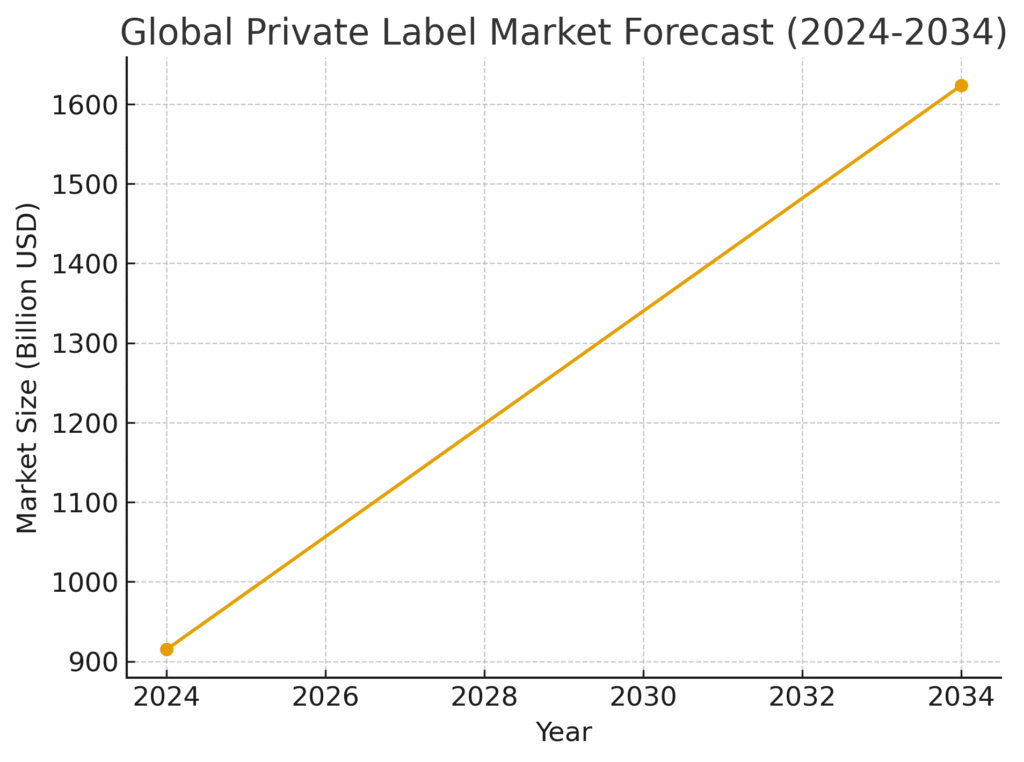
| 1 | Global private label market valued at $915.1B in 2024, projected to reach $1.62T by 2034. |
| 2 | U.S. private label industry sales hit $271B in 2024, a 3.9% increase over 2023. |
| 3 | In Europe, private label share reached 39% of grocery sales in 2024 (~$412B). |
| 4 | 99.9% of U.S. households bought at least one private label grocery item in 2024. |
| 5 | 60% of consumers believe private labels deliver above-average value for price. |
| 6 | 71% of Gen Z consumers buy cheaper alternatives to name brands. |
| 7 | Global private labels grew +5.6% in value sales in Q2 2024; Middle East/Africa led with +34.3% growth. |
| 8 | U.S. store brand sales hit $236.3B in 2022, up $10.1B from 2021. |
| 9 | Private labels captured ~23% unit share and ~20% dollar share in U.S. groceries. |
| 10 | Over 50% of U.S. retailers see private labels as their #1 growth driver in 2024. |
| 11 | Private labels deliver 25–30% higher gross margins compared to national brands. |
| 12 | Private label manufacturing costs are 40–50% lower due to leaner processes. |
| 13 | Refrigerated private label foods grew 7.5% in dollar sales YoY in 2024. |
| 14 | Over 80% of U.S. consumers rate private labels equal or better in quality vs. brands. |
| 15 | Private labels are now competing on quality, packaging, and sustainability, not just price. |
| 16 | 70% of high-income consumers choose grocery stores based on private label offerings. |
| 17 | Aldi and Trader Joe’s lead with up to 80% of sales from private labels. |
| 18 | Inflation accelerated private label adoption, with strongest growth in inflation-hit regions. |
| 19 | Many consumers have permanently switched some purchases to private labels. |
| 20 | 54% of Amazon sellers use a private label model for their businesses. |
Top 20 Private Label Marketing Statistics 2025
Private Label Marketing Statistics #1 – Global Market Valued At $915.1B In 2024
The global private label market was valued at $915.1 billion in 2024, showing its strong position in the retail sector. Analysts forecast it will reach $1.62 trillion by 2034, reflecting steady consumer trust and retailer expansion. This growth is driven by rising demand for affordable yet high-quality alternatives to national brands. Private labels are no longer just “budget” options but are evolving into strategic pillars for retailers. The steady CAGR of 5.9% confirms that this trend is here to stay.
Private Label Marketing Statistics #2 – U.S. Sales Hit $271 Billion In 2024
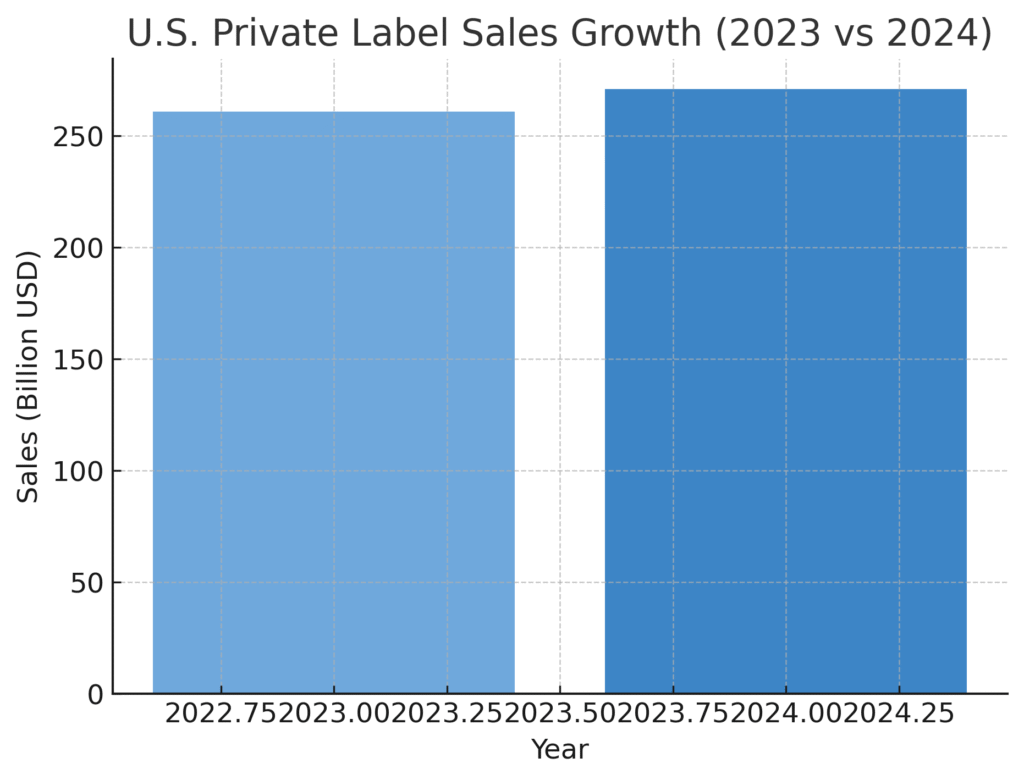
In 2024, the U.S. private label industry recorded sales of $271 billion. This marked a 3.9% increase from the previous year, highlighting strong consumer demand despite inflationary pressures. Shoppers increasingly turn to store brands for value without compromising quality. Retailers are responding by investing more in innovation and premiumization of their private label lines. This demonstrates how private labels are becoming integral to U.S. retail strategies.
Private Label Marketing Statistics #3 – Europe’s Share At 39% Of Grocery Market
Private label products accounted for 39% of Europe’s grocery market value in 2024. This equates to approximately $412 billion in sales, making Europe one of the strongest regions for private label growth. Shoppers in Europe have long embraced store brands as trusted alternatives. Countries like Spain, Switzerland, and the UK show especially high adoption rates. This cultural acceptance makes Europe a model market for private label expansion.
Private Label Marketing Statistics #4 – Nearly All U.S. Households Buy Private Labels
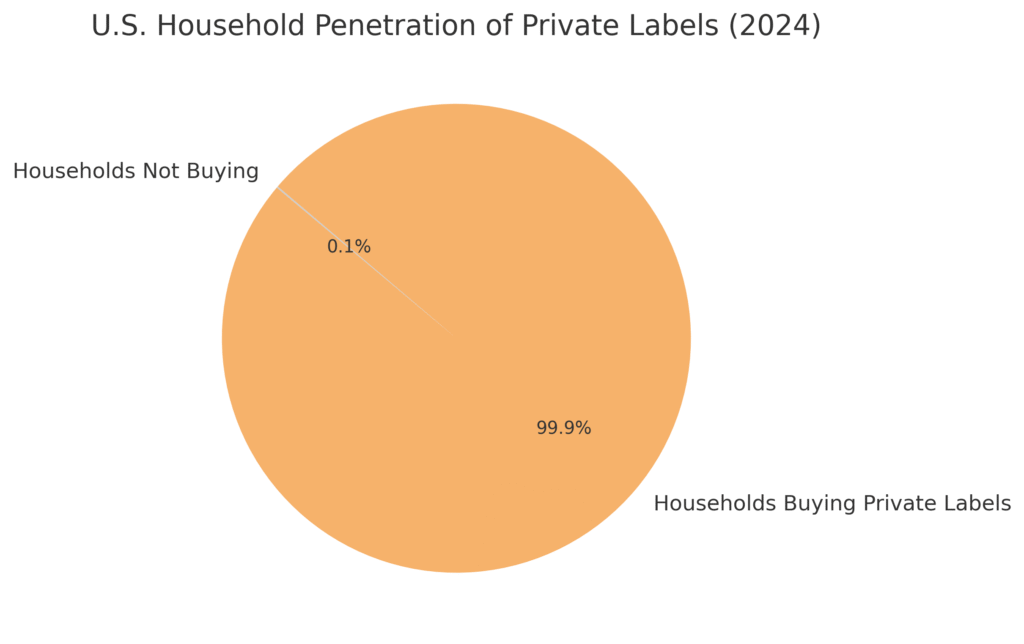
An impressive 99.9% of U.S. households purchased at least one private label grocery product in 2024. This indicates that private labels have achieved near-universal penetration in American homes. From packaged goods to fresh items, these brands are part of daily life. This level of adoption shows consumer comfort with choosing private labels over national brands. It also emphasizes how deeply embedded private labels are in U.S. shopping habits.
Private Label Marketing Statistics #5 – 60% Believe They Deliver Better Value
About 60% of consumers believe private labels deliver above-average value for money. This perception has been a major driver in their rapid adoption. Shoppers feel they can save without compromising quality, making these products attractive during inflation. Retailers leverage this perception by positioning private labels as smart, practical choices. Ultimately, this value equation makes private labels resilient even in changing economic climates.
Private Label Marketing Statistics #6 – 71% Of Gen Z Buy Cheaper Alternatives
Around 71% of Gen Z consumers say they buy cheaper alternatives to name brands. This signals that younger generations are not tied to legacy brand loyalty. Instead, they seek affordable options that fit into their budgets while still meeting expectations. Retailers are taking advantage by tailoring private label marketing to Gen Z’s digital-first lifestyle. This shift points to sustained private label growth as these shoppers mature.
Private Label Marketing Statistics #7 – Middle East And Africa Lead Growth At 34.3%
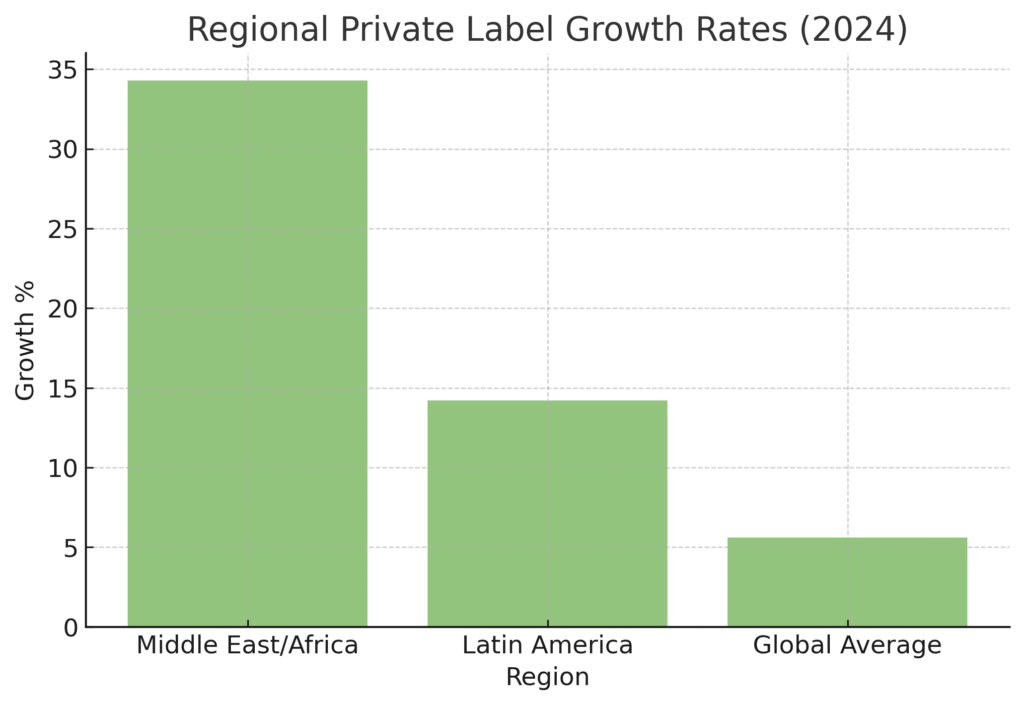
Global private label sales grew by 5.6% in Q2 2024, with the Middle East and Africa showing remarkable 34.3% growth. Inflation and rising costs in these regions pushed shoppers to seek affordable private label options. Latin America followed closely with growth around 14.2%. This trend shows that private labels thrive when consumers prioritize cost savings. Regional dynamics prove that private labels are adaptable to diverse markets.
Private Label Marketing Statistics #8 – U.S. Store Brand Sales Reached $236.3B In 2022
In 2022, U.S. store brand sales reached $236.3 billion, up $10.1 billion from 2021. This surge reflected consumers’ growing preference for retailer brands during economic uncertainty. The strong jump demonstrates that private labels are not temporary substitutes but permanent choices. Many retailers launched premium product lines to compete directly with national brands. This early momentum paved the way for even greater growth in 2024 and beyond.
Private Label Marketing Statistics #9 – 23% Unit Share And 20% Dollar Share In U.S.
Private labels in the U.S. captured around 23% of unit sales and 20% of dollar sales. This shows that while consumers buy many private label products, they often spend slightly less per unit. The statistics reveal that price positioning continues to define the category. Yet, retailers are working to increase dollar share by premiumizing their offerings. This balance of affordability and innovation strengthens their overall retail strategies.
Private Label Marketing Statistics #10 – 50% Of Retailers See Private Labels As Growth Driver
More than half of U.S. retailers identified private labels as their number one growth driver in 2024. This underscores the strategic importance of these products in retail portfolios. By controlling pricing, margins, and branding, retailers can differentiate themselves from competitors. Many also see private labels as an opportunity to increase customer loyalty. This retailer perspective ensures continued investment in the category.
Private Label Marketing Statistics #11 – 25–30% Higher Gross Margins
Private label products deliver gross margins 25–30% higher than national brands. This margin advantage makes them highly attractive to retailers seeking profitability. With reduced reliance on advertising and distribution costs, private labels can operate more efficiently. The additional revenue supports reinvestment into better packaging and innovation. These economics explain why retailers prioritize expanding their store-brand lines.
Private Label Marketing Statistics #12 – 40–50% Lower Manufacturing Costs
Private labels often enjoy 40–50% lower manufacturing costs compared to traditional brands. This is due to streamlined supply chains and fewer intermediaries. Lower costs allow retailers to price competitively while maintaining profitability. It also gives them flexibility to experiment with new product categories. This cost advantage is a critical factor in their growing dominance.
Private Label Marketing Statistics #13 – Refrigerated Foods Grew 7.5% In 2024
In 2024, refrigerated private label foods saw dollar sales growth of 7.5% year-over-year. This category’s performance shows consumer willingness to trust private labels for fresh and perishable items. Growth in general foods and beverages was also positive, though slightly lower. The data reflects how private labels are expanding beyond shelf-stable goods. Consumers are now confident in their quality across diverse food segments.
Private Label Marketing Statistics #14 – 80% Rate Quality Equal To Or Better Than Brands
Over 80% of U.S. consumers say private label food quality matches or exceeds national brands. This perception is essential to overcoming stigma that store brands are inferior. Retailers have invested heavily in product development to meet these expectations. Nearly 90% of shoppers also say private labels provide better value. These perceptions ensure ongoing loyalty even when economic conditions improve.
Private Label Marketing Statistics #15 – Competing On Quality, Packaging, And Sustainability
Private labels are no longer competing on price alone. Today, they focus on quality, stylish packaging, and sustainable practices. Retailers recognize that consumers want eco-friendly options at affordable prices. Innovative designs help these products stand out on crowded shelves. This repositioning elevates private labels to rival well-established national brands.
Private Label Marketing Statistics #16 – 70% Of High-Income Consumers Prefer Strong Private Labels
Among households earning over $100,000, about 70% choose grocery stores based on their private label offerings. This shows that private label demand spans income groups, not just budget shoppers. Wealthy consumers appreciate premium private label lines that deliver both value and exclusivity. Retailers are using this trend to attract affluent shoppers into long-term loyalty. This statistic proves private labels can serve diverse demographics successfully.
Private Label Marketing Statistics #17 – Aldi And Trader Joe’s Lead With 80% Sales From PLs
Retailers like Aldi and Trader Joe’s generate up to 80% of their sales from private labels. This demonstrates that entire business models can thrive on store-brand dominance. Their success proves the power of building strong identities around private labels. Shoppers are loyal because they trust the consistent quality and pricing. These examples inspire other retailers to expand their private label strategies.
Private Label Marketing Statistics #18 – Inflation Accelerates Adoption In Key Regions
Inflation has pushed more consumers toward private labels globally. Regions hardest hit, such as the Middle East and Africa, saw the strongest adoption. Economic uncertainty has reinforced the perception that private labels are reliable value choices. Retailers seized the moment to expand and promote their lines. This period highlights the resilience of the private label model in tough times.
Private Label Marketing Statistics #19 – Permanent Switching Behavior
Many consumers who tried private labels during inflationary periods have now permanently switched. This shows the stickiness of private label adoption once trust is built. Shoppers appreciate both value and quality, reducing reasons to return to national brands. Retailers benefit from this behavior through stronger repeat sales. Over time, this shift will have lasting effects on the consumer packaged goods industry.
Private Label Marketing Statistics #20 – 54% Of Amazon Sellers Use Private Label Model
On Amazon, 54% of sellers use a private label model. This approach allows them to create unique brands while controlling margins. It also reduces reliance on competing directly with established names. The popularity of this model highlights the entrepreneurial appeal of private labels. E-commerce is therefore expanding private label opportunities beyond traditional retail.
Wrapping It All Up
At the end of the day, private labels are no longer the quiet underdogs—they’re shaping the way we all shop and perceive value. These private label marketing statistics highlight how quickly consumer trust has grown and why so many retailers are doubling down on store brands as their strongest growth engine. For me, the most interesting part is how personal these changes feel; whether it’s choosing a store brand coffee or noticing new packaging on familiar shelves, we all experience these shifts firsthand. It shows that behind every percentage and growth figure, there are real people making choices that ripple across the entire industry. And that’s the part of marketing that never feels like just numbers—it’s about connecting with everyday decisions that matter.
SOURCES
- https://customcy.com/blog/private-label-statistics/ (Customcy)
- https://plma.com/sites/default/files/files/2024-02/yearend-report2024-final.pdf (PLMA)
- https://www.numerator.com/resources/blog/gen-z-private-label/ (Numerator)
- https://www.whitelabelexpo.com/blog-library/rise-private-label-shift-consumer-perception-means-providers (White Label World Expo 2025)
- https://www.bazaarvoice.com/blog/why-private-label-brands-are-taking-over-in-2025/ (Bazaarvoice)
- https://www.lek.com/sites/default/files/PDFs/retail-private-label.pdf (L.E.K. Consulting)
- https://alvarezandmarsal-crg.com/wp-content/uploads/2022/04/Store-Brands-Driving-Growth-And-Building-Loyalty.pdf (Alvarez & Marsal CRG)
- https://cdn.tridge.com/market_report_report/8f/ed/6e/8fed6e6565c335569553120c4b2bb3c92db2d30f/Private_Label_Report_Americas.pdf (Tridge)
- https://www.researchgate.net/publication/334576305_Consumer_Perceptions_of_Private_Label_Brands_in_Pakistan (ResearchGate)
- https://www.researchgate.net/publication/328269313_Consumer_Perception_of_Private_Label_Products_An_Empirical_Research (ResearchGate)
- https://www.researchgate.net/publication/328457467_Empirical_Study_of_Impact_of_Promotion_of_Store_Brands_Private_Labelled_in_Chain_Stores_in_Pakistan (ResearchGate)
- https://www.foodandwine.com/private-label-grocery-brands-nielseniq-report-2025-11753077 (Food & Wine)