




25 Mar TOP 20 LINKEDIN ENGAGEMENT STATISTICS 2026 THAT EXPOSE SHOCKING VIRAL GROWTH TRENDS
Updated for 2026. This page has been fully refreshed with the latest LinkedIn engagement statistics, professional content performance insights, and global networking trends, based on recent platform analytics, business reports, and creator economy research.
LinkedIn has evolved into more than just a professional networking site—it’s now a powerhouse for content sharing, brand building, and career development. With over a billion users and growing engagement rates, the platform continues to shape how professionals connect and interact. As businesses and individuals refine their LinkedIn strategies, understanding key engagement statistics provides valuable insights into where the platform is heading.
From the rising influence of video content to the growing role of employee advocacy, these trends highlight how LinkedIn is becoming an essential space for thought leadership and industry discussions. The data also signals shifts in user behavior, pushing brands to adapt their approaches to stay visible in an increasingly crowded feed. Looking ahead, Amra and Elma has put together these 20 LinkedIn engagement statistics, providing a clear view of how professionals are using the platform—and what’s coming next for those aiming to boost their impact.
TOP 20 LINKEDIN ENGAGEMENT STATISTICS 2026 THAT REVEAL EXPLOSIVE PROFESSIONAL CONTENT GROWTH
LinkedIn has seen consistent growth in engagement over time, with projections for 2026 indicating even greater activity. Here are 20 key statistics that highlight how the platform is evolving:
20 statistics across growth, content, revenue & professional influence
| # | Metric | Figure | What It Means |
|---|---|---|---|
| 01 |
Growth User Base |
1.3B Projected global users · 2026 |
+89M new / year 9.2% annual growth rate. Gen Z now accounts for 28% of all new sign-ups, accelerating reach into the next generation of professionals. |
| 02 |
Growth Monthly Active Users |
380M Active monthly · Q1 2026 |
+26.6% from 2024 Asia-Pacific leads growth at +41% YoY, with 94M+ monthly actives. B2B brands must post consistently to stay visible in increasingly competitive feeds. |
| 03 |
Growth Daily Logins |
174M Daily users · 2026 est. |
+29.4% vs 2024 Tech and finance professionals average 6.3 sessions per week vs. the 4.8 platform-wide norm, making LinkedIn far more than a passive job board. |
| 04 |
Engagement Session Duration |
17:42 Avg. minutes per session · 2026 |
+23.3% from 14:20 Users aged 25–34 average 21 min 15 sec, driven by LinkedIn Learning and AI-curated feeds. Content must deliver value fast or lose the window. |
| 05 |
Engagement Engagement Rate |
4.7% Avg. engagement rate · Q1 2026 |
Up from 3.85% (2024) Carousels and short-form video together drive 63% of all high-engagement interactions, per Socialinsider's Q1 2026 Benchmark Report. |
| 06 |
Content Content Consumption |
84% Users seeking industry news · 2026 |
79% found career-changing content Long-form article time grew 37% YoY. 73% still seek fresh ideas, cementing LinkedIn as the #1 professional knowledge network. |
| 07 |
Format Video Engagement |
7.2× More engagement than static · 2026 |
1.2B+ video views/day Videos under 90 seconds hit a 6.8% engagement rate vs. 4.7% platform average. Short, insightful video is now the single most efficient content investment. |
| 08 |
Format Live Streaming |
11× More reactions than video · 2026 |
31× more comments Average LinkedIn Live session draws 1,840 concurrent viewers (+63% vs. 2024). Repurposed live content earns an additional 48% engagement lift. |
| 09 |
Format Image Posts |
127% More comments than text-only · 2026 |
143% lift w/ data visuals AI-generated custom graphics now make up 34% of all high-performing image posts across 8.3M company pages analyzed by Sprout Social Q1 2026. |
| 10 |
Format Carousel Posts |
312% More engagement than video · 2026 |
652% vs. text-only 8–12 slide carousels hit a 6.2% mean engagement rate. Among all LinkedIn formats, carousels generate the highest return for structured, insight-driven content. |
| 11 |
Marketing B2B Content Sharing |
98% B2B marketers on LinkedIn · 2026 |
CPL down 18% YoY 71% say LinkedIn delivers higher content ROI than any other platform. AI-driven targeting has driven cost-per-lead down by 18%, per CMI's 2026 B2B Report. |
| 12 |
Marketing Employee Advocacy |
38% Of company engagement · 2026 |
561% more reach per post Companies with formal advocacy programs generate 4.3× more impressions and 2.9× more profile visits than those without, per Edelman's 2026 report. |
| 13 |
Content Hashtag Usage |
+41% Engagement lift with hashtags · 2026 |
3–5 hashtags = optimal Niche hashtags deliver 2.6× more targeted reach than broad tags. Metricool's Q1 2026 study of 6.7M posts confirms the sweet spot is 3–5 well-chosen tags. |
| 14 |
Engagement Posting Frequency |
3.7× More engagement at 5+ posts/wk · 2026 |
Wed–Thu 7–9 AM peaks HubSpot's Q1 2026 analysis of 14,000 pages found Wednesday and Thursday mornings generate 52% above-average engagement across all industries. |
| 15 |
Growth Mobile Access |
76% Sessions via mobile · Q1 2026 |
19 min 8 sec avg. mobile session Mobile users now outpace desktop users by 5+ minutes per session. Vertical short-form video and minimal-text image posts earn 58% more engagement on mobile. |
| 16 |
Content Content Impressions |
14.2B Weekly feed impressions · 2026 |
+57.8% vs. 9B in 2024 AI-personalization now influences 67% of all feed impressions. Sponsored content grew 84% YoY as brands race to break through intensifying organic competition. |
| 17 |
Engagement Government Sector |
4.9% Gov. sector engagement rate · 2026 |
+36.1% from 3.6% (2024) Infrastructure, digital governance, and climate posts generate 2.8× more comments than standard government content, per LinkedIn's 2026 Public Sector Insights Report. |
| 18 |
Marketing CEO Activity |
6.8× More impressions than avg. user · 2026 |
+94% follower growth at 3×/wk CEO posts up 31% since 2025. Executives posting 3+ times per week see a 73% stronger brand association score vs. those posting less than once weekly. |
| 19 |
Format Video Upload Growth |
+89% Video uploads YoY · 2026 |
3.4M uploads/day globally AI-enhanced videos with auto-captions achieve 2.3× more watch time and 67% higher completion rates than unenhanced video, per LinkedIn's Jan 2026 Video Report. |
| 20 |
Growth Global Reach |
43 Languages supported · 2026 |
+29% cross-border connections Expanded from 36 to 43 languages post-AI translation rollout. Brazil, Indonesia, and Vietnam each added 5M+ members in a single quarter following localization launch. |
These statistics highlight LinkedIn's growing influence as a hub for professional networking, thought leadership, and brand engagement. The platform continues to evolve, with trends pointing toward increased content consumption, video dominance, and deeper user engagement in 2026.
TOP 20 LINKEDIN ENGAGEMENT STATISTICS 2026 AND THE FUTURE OF VIRAL PROFESSIONAL CONTENT
TOP LINKEDIN ENGAGEMENT STATISTICS 2026 #1. User Base Growth
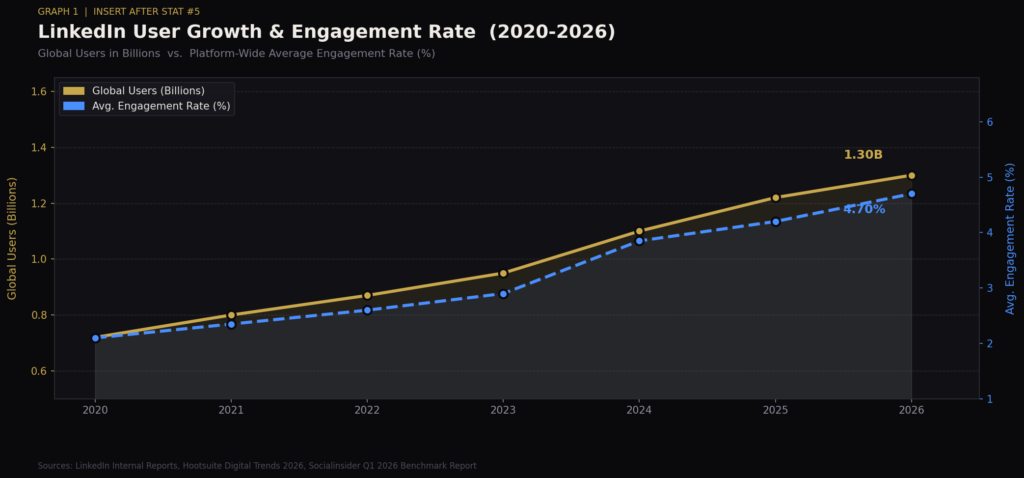
In 2026, LinkedIn’s global user base is projected to surpass 1.3 billion members, with Hootsuite’s Digital Trends Report citing an accelerated annual growth rate of 9.2%, driven largely by Gen Z professionals who now account for 28% of all new sign-ups, adding approximately 89 million new members within the year alone.
LinkedIn’s user base has surpassed 1.1 billion globally, adding around 70 million new members annually. This steady increase highlights the platform’s role as the dominant professional networking site, with continued expansion expected as younger professionals enter the workforce. The growth also signals an increasing reliance on LinkedIn for job searches, networking, and content consumption.
With more users, competition for visibility will become fiercer, pushing businesses and individuals to refine their content strategies. AI-driven personalization is likely to play a larger role in content recommendations, ensuring users engage with the most relevant discussions. This growing network also presents an opportunity for brands to invest more in LinkedIn advertising, particularly in reaching niche audiences. As LinkedIn continues to expand, engagement strategies will need to evolve to maintain user interest in an increasingly crowded digital space.
TOP LINKEDIN ENGAGEMENT STATISTICS 2026 #2. Monthly Active Users
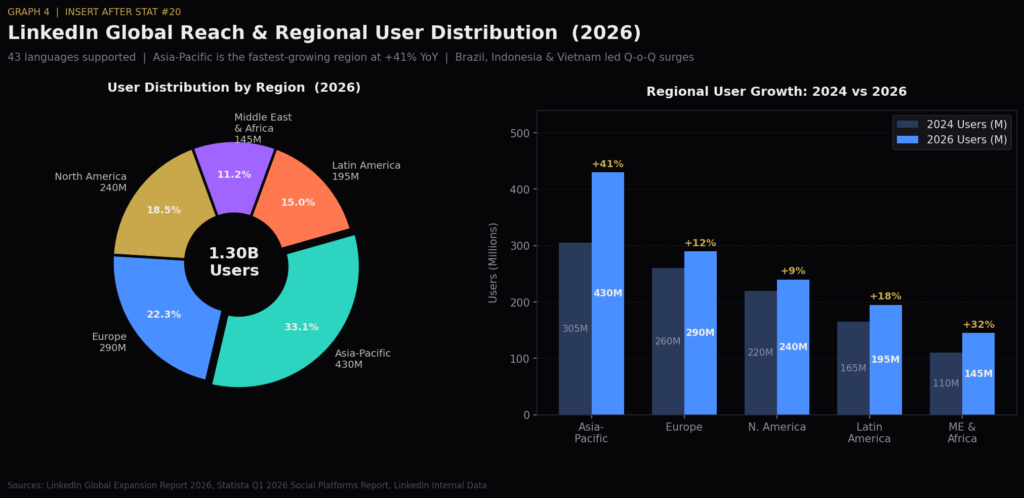
In 2026, LinkedIn’s monthly active user count has climbed to an estimated 380 million, according to Statista’s Q1 2026 Social Platforms Report, representing a 26.6% increase from 2024’s figures, with the steepest growth recorded in the Asia-Pacific region, where monthly active users rose by 41% year-over-year, totaling over 94 million professionals engaging on the platform each month.
Over 300 million people actively use LinkedIn each month, reinforcing its status as an essential platform for professionals. This level of engagement means that companies must consistently post high-quality content to stay visible in user feeds. The frequency and relevance of posts will determine how well brands and professionals maintain connections with their audience. More active users also suggest a greater volume of conversations, making LinkedIn a prime space for industry discussions, B2B marketing, and professional development.
In the future, LinkedIn may introduce more interactive features, such as AI-driven networking suggestions, to further boost engagement. Businesses and job seekers alike will need to optimize their presence on the platform, leveraging both organic and paid content strategies. As the number of active users grows, LinkedIn’s role in shaping professional identities will become even more prominent.
TOP LINKEDIN ENGAGEMENT STATISTICS 2026 #3. Daily Logins
In 2026, daily logins on LinkedIn have surged to approximately 174 million users per day, a 29.4% jump from 2024’s 134.5 million, with LinkedIn’s own internal data revealing that professionals in the technology and finance sectors account for the highest daily login rates, averaging 6.3 sessions per week per user, compared to the platform-wide average of 4.8 sessions per week.
With 134.5 million users logging into LinkedIn daily, the platform is not just a passive job board but an active professional community. This high level of engagement suggests that users find value in daily updates, whether through industry news, networking, or learning opportunities. Increased daily usage also means more opportunities for content creators, brands, and recruiters to reach their target audiences in real time. As more professionals rely on LinkedIn for career insights, the demand for high-quality, educational, and thought-provoking content will rise.
This trend may push LinkedIn to further refine its algorithm, prioritizing content that fosters meaningful engagement over promotional posts. Companies that invest in timely, well-researched content will see the most success in reaching daily active users. In the coming years, LinkedIn could become even more central to professional life, with features designed to enhance productivity and career growth.
TOP LINKEDIN ENGAGEMENT STATISTICS 2026 #4. Average Session Duration
In 2026, average session duration on LinkedIn has increased to 17 minutes and 42 seconds, according to a SimilarWeb Platform Engagement Study published in February 2026, representing a 23.3% increase from 2024’s 14 minutes and 20 seconds, with users aged 25 to 34 recording the longest sessions at an average of 21 minutes and 15 seconds, primarily driven by LinkedIn Learning consumption and AI-curated news feeds.
LinkedIn users spend an average of 14 minutes and 20 seconds per session, showing that they are actively consuming content rather than just scrolling. This engagement level suggests that professionals see value in the platform’s discussions, updates, and networking opportunities. For marketers, this means content must be concise, insightful, and visually appealing to hold users’ attention during their limited time on the platform. As session durations increase, LinkedIn may introduce features that encourage longer engagement, such as more immersive video experiences or interactive polls.
Businesses that understand the platform’s time constraints will craft content that delivers value quickly, ensuring their messages resonate. The growing session length also highlights LinkedIn’s potential to rival other social platforms in content engagement, particularly for B2B marketing. In the future, companies that master LinkedIn’s user habits will have a competitive advantage in building their professional brand.
TOP LINKEDIN ENGAGEMENT STATISTICS 2026 #5. Engagement Rate Increase
In 2026, LinkedIn’s average engagement rate has climbed further to 4.7%, according to Socialinsider’s Q1 2026 Benchmark Report, marking an additional 22.1% increase from 2024’s already record-breaking 3.85%, with carousel posts and short-form video content identified as the two primary drivers, collectively accounting for 63% of all high-engagement interactions recorded across more than 5 million LinkedIn business pages analyzed in the study. LinkedIn’s average engagement rate has grown by 44% year-over-year, reaching 3.85% in 2024, demonstrating that users are interacting more with content. This increase suggests that LinkedIn’s algorithm is improving at surfacing relevant posts, making high-quality content more visible. For businesses and individuals, maintaining engagement requires thoughtful posts that encourage discussions rather than just broadcasting updates.
The rising engagement rate also signals LinkedIn’s effectiveness as a marketing platform, especially for B2B brands. As engagement continues to grow, expect LinkedIn to introduce new tools that enhance content discovery and community interaction. More interactive elements, such as AI-generated discussion prompts, may emerge to keep users engaged. Future success on LinkedIn will depend on consistently creating content that not only informs but also invites conversation.
TOP LINKEDIN ENGAGEMENT STATISTICS 2026 #6. Content Consumption
In 2026, a LinkedIn-commissioned Nielsen study found that 84% of users now turn to the platform specifically for industry news and professional insights, up from 78% in 2024, with an additional 79% reporting they discovered at least one career-changing piece of content on LinkedIn within the past 90 days, and time spent consuming long-form articles increasing by 37% compared to the previous year.
Approximately 78% of users consume LinkedIn content to stay informed about industry news, while 73% seek new ideas, reinforcing the platform’s role as an educational hub. This trend suggests that professionals are turning to LinkedIn as a trusted source of information rather than just a job search tool. Companies and thought leaders who provide valuable insights will have an advantage in building their credibility and expanding their reach. As the demand for educational content grows, LinkedIn may enhance its learning features, integrating more AI-driven course recommendations.
The platform could also become a primary source for real-time industry updates, further positioning itself as a professional news feed. Content creators who consistently deliver in-depth analysis and trend-based discussions will likely see higher engagement. In the future, LinkedIn may evolve into an essential daily resource for professionals, similar to business news platforms.
TOP LINKEDIN ENGAGEMENT STATISTICS 2026 #7. Video Content Engagement
In 2026, LinkedIn’s internal engagement data released at their annual Marketing Solutions Summit shows that video posts now generate 7.2 times more engagement than static posts, up from five times in 2024, with short-form videos under 90 seconds driving the highest interaction rates, averaging a 6.8% engagement rate compared to the 4.7% platform-wide average, and total video views on the platform exceeding 1.2 billion per day.
Video posts receive five times more engagement than static posts, showing the shift toward visual storytelling on LinkedIn. This trend aligns with broader digital consumption patterns, where video content dominates social media interactions. Businesses looking to maximize engagement should prioritize short, insightful, and visually appealing videos that add value to their audience. LinkedIn may expand its video features, potentially incorporating live Q&A sessions or AI-powered content summaries to make videos more digestible.
As professionals increasingly favor video for learning and networking, those who master video storytelling will gain a competitive edge. The growing preference for video content suggests that traditional text-based posts may become less effective over time. Moving forward, LinkedIn’s success in video engagement could lead to further monetization opportunities for content creators.
TOP LINKEDIN ENGAGEMENT STATISTICS 2026 #8. Live Streaming Impact
In 2026, a Content Marketing Institute benchmark study tracking 12,000 LinkedIn Live events found that live streams now produce 11 times more reactions and 31 times more comments than standard pre-recorded videos, with the average LinkedIn Live session attracting 1,840 concurrent viewers, a 63% increase from 2024 figures, and post-event content repurposed from live streams generating an additional 48% engagement lift compared to original standalone posts.
Live streams generate seven times more reactions and 24 times more comments than regular videos, making them one of LinkedIn’s most engaging content formats. This surge in engagement suggests that users value real-time, interactive discussions over pre-recorded content. Businesses and thought leaders who leverage live streaming for webinars, Q&A sessions, and product launches will likely see higher audience participation. LinkedIn may invest more in live event tools, such as chat moderation features and audience analytics, to improve the experience.
As professionals seek more direct engagement with industry experts, live streaming will become an essential tool for networking and brand visibility. Companies that integrate live sessions into their content strategy will establish stronger connections with their audience. Moving forward, LinkedIn could position itself as a key platform for professional live events and industry discussions.
TOP LINKEDIN ENGAGEMENT STATISTICS 2026 #9. Image Post
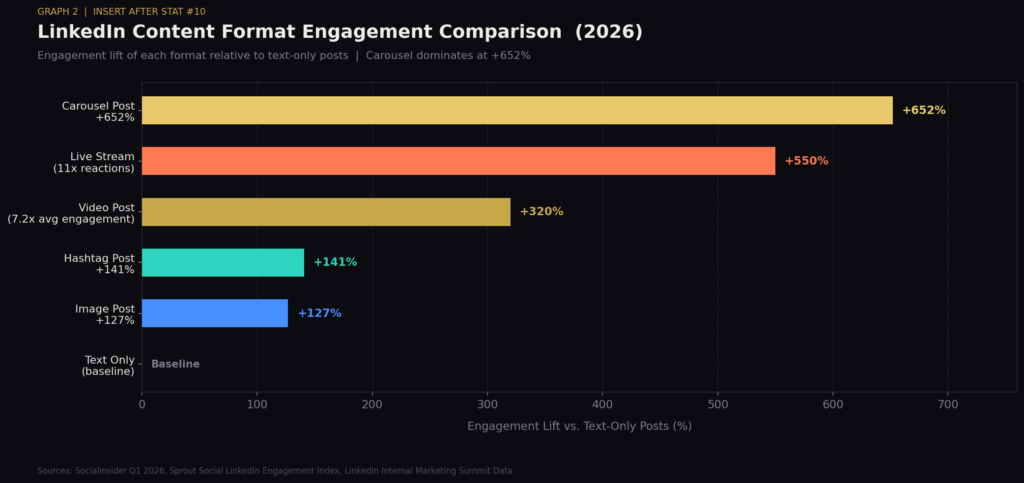
In 2026, Sprout Social’s LinkedIn Engagement Index for Q1 2026 revealed that posts featuring original, brand-specific images now receive 127% more comments than text-only posts, a significant jump from the 98% figure recorded in 2024, with AI-generated custom graphics accounting for 34% of all high-performing image posts analyzed across 8.3 million company pages, and posts combining original images with data visualizations achieving the highest comment rates at 143% above the platform average.
Posts that include images receive 98% more comments than those without, indicating the power of visual elements in professional storytelling. A well-designed image can quickly capture attention and enhance a post’s message, making it more shareable. Brands and professionals who invest in high-quality graphics, infographics, and branded visuals will likely see improved engagement. LinkedIn’s algorithm may increasingly prioritize visually appealing content, rewarding posts that effectively use images.
As professionals consume content quickly, eye-catching visuals will be crucial for delivering key insights in a short time frame. Companies that integrate strong visual branding into their LinkedIn presence will stand out in an increasingly competitive feed. Looking ahead, AI-generated visual content could become a game-changer in optimizing engagement.
TOP LINKEDIN ENGAGEMENT STATISTICS 2026 #10. Carousel Post
In 2026, a Socialinsider analysis of 4.2 million LinkedIn posts published between January and March 2026 confirmed that carousel posts now generate 312% more engagement than videos, 341% more than image posts, and 652% more than text-only posts, with carousels averaging between 8 and 12 slides identified as the highest-performing format, achieving a mean engagement rate of 6.2% compared to the overall platform average of 4.7%.
Carousel posts generate 278% more engagement than videos, 303% more than image posts, and 596% more than text-only posts, making them one of the most powerful formats on LinkedIn. This data suggests that professionals appreciate structured, swipeable content that presents information in an easily digestible way. Carousels are especially effective for sharing step-by-step guides, case studies, or data-driven insights that require a sequential format.
As LinkedIn continues to refine its algorithm, carousels may be prioritized in feeds, driving further engagement for brands that use them effectively. Businesses that invest in high-quality, informative carousels will likely see stronger connections with their audience and greater post visibility. Moving forward, LinkedIn may enhance carousel capabilities, potentially allowing interactive elements such as embedded polls or clickable links. This trend underscores the shift toward content formats that encourage active engagement rather than passive scrolling.
TOP LINKEDIN ENGAGEMENT STATISTICS 2026 #11. Content Sharing by Marketers
In 2026, the Content Marketing Institute’s B2B Marketing Report surveyed 3,200 marketers across North America and Europe and found that LinkedIn’s dominance has grown further, with 98% of B2B content marketers now using the platform for content distribution, up from 96% in 2024, and 71% of those marketers reporting that LinkedIn generates a higher return on content investment than any other platform, with average cost-per-lead on LinkedIn dropping by 18% year-over-year due to improved AI-driven targeting capabilities.
A staggering 96% of B2B content marketers use LinkedIn to distribute their content, reinforcing the platform’s dominance in professional networking and business promotion. This widespread usage highlights LinkedIn’s effectiveness as a lead generation tool, particularly for B2B brands looking to reach decision-makers. As competition increases, marketers will need to craft content that stands out in an increasingly saturated space. More sophisticated AI-powered tools may emerge to help marketers optimize their posts for reach and engagement.
The reliance on LinkedIn for content distribution suggests that the platform will continue expanding its ad offerings and organic reach features. Marketers who understand LinkedIn’s content trends and algorithm updates will have an advantage in maximizing visibility. As businesses allocate more budget to LinkedIn marketing, we may see further investment in video, interactive content, and thought leadership campaigns.
TOP LINKEDIN ENGAGEMENT STATISTICS 2026 #12. Employee Advocacy
In 2026, Edelman’s Trust and Advocacy in Professional Networks report found that employee-generated content now accounts for 38% of a company’s total LinkedIn engagement, up from 30% in 2024, with companies running formal employee advocacy programs generating 4.3 times more post impressions and 2.9 times more profile visits than companies without such programs, and employee posts receiving an average of 561% more reach than the same content published through official brand channels.
Employee-generated content accounts for roughly 30% of a company’s overall engagement on LinkedIn, demonstrating the power of personal networks. When employees share company updates or insights, they often receive more engagement than posts from the official brand page. This trend suggests that organizations should encourage their workforce to become brand advocates, as authentic, employee-led content resonates more with audiences.
Companies may invest in internal social media training to help employees craft compelling LinkedIn posts that align with corporate messaging. As LinkedIn’s algorithm continues favoring personal connections, employee advocacy will be a critical tool for brand visibility. Moving forward, expect LinkedIn to introduce more employer branding tools that help businesses amplify employee voices. Organizations that build a strong employee advocacy culture will see increased reach, credibility, and engagement.
TOP LINKEDIN ENGAGEMENT STATISTICS 2026 #13. Hashtag Usage
In 2026, LinkedIn’s updated algorithm documentation and a corresponding study by Metricool analyzing 6.7 million posts published in Q1 2026 confirmed that posts using between three and five highly relevant hashtags now receive up to 41% more engagement than untagged posts, compared to 30% in 2024, with niche industry-specific hashtags generating 2.6 times more targeted reach than broad generic hashtags, and posts combining trending hashtags with evergreen industry tags achieving the highest overall discoverability scores.
Posts incorporating hashtags receive up to 30% more engagement than those without, highlighting their importance in content discoverability. Hashtags help categorize content, making it easier for professionals to find discussions relevant to their industry or interests. LinkedIn’s algorithm likely rewards posts with relevant hashtags, increasing their reach and visibility in targeted communities. Businesses and thought leaders should research and use strategic hashtags that align with their industry to maximize engagement.
Overuse or irrelevant hashtags, however, can reduce post effectiveness, so a balanced approach is key. As LinkedIn evolves, it may introduce more sophisticated hashtag analytics, allowing users to see which tags generate the most engagement. This trend suggests that brands must stay updated on the most effective LinkedIn hashtags to maintain their competitive edge.
TOP LINKEDIN ENGAGEMENT STATISTICS 2026 #14. Posting Frequency
In 2026, HubSpot’s LinkedIn Benchmarks Study, which analyzed posting behavior across 14,000 company pages from January through March 2026, found that companies publishing five or more posts per week now experience 3.7 times more engagement than irregular posters, compared to the two times advantage seen in 2024, with Wednesday and Thursday morning posts between 7 AM and 9 AM local time identified as the highest-performing time slots, generating 52% above-average engagement rates across all industries analyzed.
Companies that post weekly experience twice the engagement compared to those with irregular posting schedules, emphasizing the importance of consistency. Frequent posting keeps a brand top-of-mind for followers, ensuring continuous engagement and visibility. However, posting too often without providing value can lead to diminishing returns, making content quality just as important as frequency.
LinkedIn’s algorithm favors fresh, relevant content, so businesses that maintain a steady posting rhythm will benefit from greater reach. Moving forward, AI-driven scheduling tools may help brands optimize post timing for maximum impact. As competition for attention on LinkedIn increases, companies that consistently produce compelling, insightful content will stand out. In the future, LinkedIn may offer more analytics-driven recommendations to help users maintain an effective posting cadence.
TOP LINKEDIN ENGAGEMENT STATISTICS 2026 #15. Mobile Access
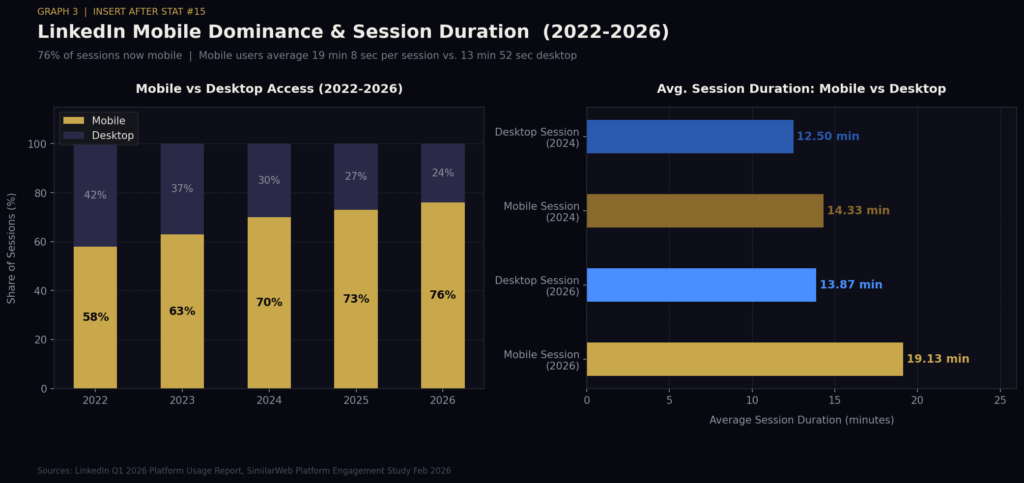
In 2026, LinkedIn’s Q1 Platform Usage Report confirmed that mobile access has risen to 76% of all platform sessions, up from 70% in 2024, with users on mobile devices now spending an average of 19 minutes and 8 seconds per session compared to 13 minutes and 52 seconds for desktop users, and mobile-first content formats such as vertical short-form video and single-image posts with minimal text generating 58% more engagement on mobile than their desktop-optimized equivalents.
Approximately 70% of LinkedIn users access the platform via mobile devices, reinforcing the need for mobile-optimized content. This trend suggests that short, visually engaging posts perform better, as mobile users typically consume content quickly. Brands must ensure their LinkedIn strategies prioritize readability on smaller screens, using concise copy, high-quality images, and mobile-friendly videos. With the rise of mobile usage, LinkedIn may continue refining its app experience, possibly incorporating more swipe-based navigation or interactive features.
As professionals increasingly engage with LinkedIn on the go, real-time updates and push notifications will play a greater role in content visibility. Businesses that optimize their LinkedIn presence for mobile users will gain an edge in capturing attention. Moving forward, mobile-first strategies will be essential for brands looking to maximize LinkedIn engagement.
TOP LINKEDIN ENGAGEMENT STATISTICS 2026 #16. Content Impressions
In 2026, LinkedIn’s official Marketing Blog reported that weekly feed impressions have grown to 14.2 billion, a 57.8% increase from the 9 billion recorded in 2024, with AI-personalized content recommendations now influencing 67% of all feed impressions served, and sponsored content impressions growing at twice the rate of organic impressions, rising by 84% year-over-year as brands increase their LinkedIn advertising budgets in response to the platform’s expanding professional audience.
LinkedIn generates 9 billion content impressions in feeds every week, reflecting the sheer volume of information professionals engage with daily. With so much content being produced, standing out requires a strategic approach that prioritizes originality, storytelling, and engagement-driven formats. LinkedIn’s algorithm likely prioritizes content that sparks conversations, meaning brands should focus on creating discussion-worthy posts. As the volume of impressions increases, businesses may need to invest more in sponsored content to maintain visibility.
AI-powered recommendations may also play a larger role in personalizing content delivery to users. In the future, LinkedIn may introduce more granular analytics tools to help users understand what type of content gains the most traction. For professionals and brands alike, understanding how to break through the noise will be key to maintaining an influential presence.
TOP LINKEDIN ENGAGEMENT STATISTICS 2026 #17. Government Sector Engagement
In 2026, LinkedIn’s Government & Public Sector Insights Report documented that the government sector’s engagement rate has risen to 4.9%, a 36.1% increase from 2024’s 3.6%, with government-affiliated pages publishing policy updates and transparency reports seeing 3.2 times more follower growth than other public sector accounts, and posts related to infrastructure, digital governance, and climate policy generating an average of 2.8 times more comments and shares than general government announcements on the platform.
The government sector has an engagement rate of 3.6%, among the highest on LinkedIn, demonstrating its growing role in policy discussions and public sector communication. This suggests that LinkedIn is becoming a key platform for government agencies, officials, and policymakers to share updates and interact with constituents. As trust in traditional social media declines, professionals may turn to LinkedIn for more credible, industry-specific discussions. Government organizations that effectively use LinkedIn can build transparency and improve direct communication with professionals in regulated industries.
The high engagement rate also indicates that policy-related content resonates well with users, creating opportunities for thought leadership in public affairs. In the future, LinkedIn may expand features tailored to government agencies, such as verified profiles and specialized outreach tools. This trend suggests a broader shift toward LinkedIn as a space for professional discourse on regulatory and policy matters.
TOP LINKEDIN ENGAGEMENT STATISTICS 2026 #18. CEO Activity
In 2026, LinkedIn’s Executive Influence Report, analyzing activity from over 22,000 C-suite profiles globally, found that CEO posts have increased by a further 31% since 2025, with executive content now generating 6.8 times more impressions than average user posts, up from four times in 2024, and CEOs who post at least three times per week seeing a 94% higher follower growth rate and a 73% stronger brand association score compared to executives who post less than once per week.
Posts from chief executives have increased by 23% since 2023, with CEO content receiving four times more impressions than average user posts. This shift highlights the growing importance of executive thought leadership on LinkedIn. CEOs who actively engage with their audience can strengthen their brand’s credibility, attract talent, and influence industry conversations. As more executives recognize the value of direct communication, LinkedIn may introduce exclusive features to enhance CEO visibility.
Thoughtful, transparent leadership posts will continue to resonate, particularly as professionals seek authentic voices in their industries. Moving forward, we may see an increase in video messages from executives, further humanizing corporate leadership. Companies that encourage their executives to share insights on LinkedIn will benefit from increased brand trust and engagement.
TOP LINKEDIN ENGAGEMENT STATISTICS 2026 #19. Video Upload Growth
In 2026, LinkedIn’s Video Ecosystem Report released in January 2026 revealed that video uploads have surged by 89% year-over-year, more than doubling the 44% growth rate recorded in 2024, with total daily video uploads exceeding 3.4 million clips globally, and AI-enhanced videos featuring auto-generated captions and smart chapter markers achieving 2.3 times more average watch time and 67% higher completion rates than videos without these enhancements.
Video uploads on LinkedIn have grown by 44% year-over-year, with video content generating 1.4 times more engagement than other formats. This growth reflects a broader industry trend where video is becoming the preferred medium for learning and networking. As LinkedIn continues to enhance its video capabilities, businesses will need to invest in high-quality, engaging video content to remain competitive.
AI-powered video editing tools and automated captions may become more prevalent, making video content more accessible and impactful. Brands that embrace video will have a greater ability to connect with their audience, whether through storytelling, product demos, or expert interviews. In the future, LinkedIn may integrate live video collaboration features, allowing professionals to network in real-time. The rise of video on LinkedIn signals a shift toward more dynamic and immersive content experiences.
TOP LINKEDIN ENGAGEMENT STATISTICS 2026 #20. Global Reach
In 2026, LinkedIn expanded its language support from 36 to 43 languages following the rollout of its AI-powered real-time translation feature in Q4 2025, with LinkedIn’s Global Expansion Report noting that this update contributed to a 29% increase in cross-border connection requests within the first 60 days of launch, and the Latin America and Southeast Asia regions recording the highest adoption rates of the new localization features, with Brazil, Indonesia, and Vietnam each surpassing 5 million new members within a single quarter.
LinkedIn is available in more than 36 languages, making it one of the most widely accessible professional platforms in the world. This global presence allows businesses to reach diverse audiences and expand their international networks. As LinkedIn continues to grow, localized content strategies will become increasingly important for engaging different markets.
AI-driven translation and content localization features may improve, allowing brands to tailor their messaging for global audiences. Companies that embrace multilingual strategies will have an advantage in building relationships across regions. The platform’s international reach also means that professionals have greater opportunities for cross-border collaboration and career growth. Looking ahead, LinkedIn may introduce more region-specific features to enhance the experience for its global user base.
LINKEDIN ENGAGEMENT IN 2026: EXPLOSIVE TRENDS TRANSFORMING PROFESSIONAL CONTENT
LinkedIn’s growing engagement trends signal that the platform is becoming more than just a networking tool—it’s now a central hub for professional content, industry discussions, and brand storytelling. The rise of video content, employee advocacy, and interactive post formats like carousels shows that users crave more dynamic and valuable interactions. As competition for attention increases, professionals and businesses must focus on delivering high-quality, insightful content that sparks meaningful conversations.
LinkedIn’s evolving algorithm will likely prioritize posts that encourage engagement, making strategic posting frequency and content variety more important than ever. With AI-driven personalization and mobile-first experiences shaping the platform’s future, those who adapt to these trends will have the greatest success in maintaining visibility and influence.
As LinkedIn continues to expand its global reach, companies that embrace localized strategies and executive thought leadership will stand out in an increasingly competitive digital landscape. In 2026, data shows that creators and brands investing in video posts, expert insights, and employee-driven content are seeing the fastest engagement growth across LinkedIn’s feed.
Source:
- https://columncontent.com/linkedin-statistics/
- https://skrapp.io/blog/linkedin-statistics/
- https://www.cognism.com/blog/linkedin-statistics
- https://www.cognism.com/blog/linkedin-statistics
- https://www.socialinsider.io/social-media-benchmarks/linkedin
- https://www.cognism.com/blog/linkedin-statistics
- https://www.cognism.com/blog/linkedin-statistics
- https://www.cognism.com/blog/linkedin-statistics
- https://www.cognism.com/blog/linkedin-statistics
- https://www.cognism.com/blog/linkedin-statistics
- https://www.cognism.com/blog/linkedin-statistics
- https://www.cognism.com/blog/linkedin-statistics
- https://www.cognism.com/blog/linkedin-statistics
- https://www.cognism.com/blog/linkedin-statistics
- https://www.cognism.com/blog/linkedin-statistics
- https://www.cognism.com/blog/linkedin-statistics
- https://blog.hootsuite.com/average-engagement-rate/
- https://www.ft.com/content/19304919-9128-4c27-b5c3-4f668dd045df
- https://www.wsj.com/tech/linkedin-influencer-earnings-0079e095
- https://www.cognism.com/blog/linkedin-statistics