




08 Mar TOP 20 SOCIAL MEDIA ENGAGEMENT STATISTICS 2026 THAT TERRIFY MARKETERS AND EXPLODE BRAND GROWTH
Updated for 2026. This page has been fully refreshed with the latest social media engagement statistics, platform interaction trends, and digital marketing behavior insights, grounded in recent global surveys, creator economy reports, and social platform analytics.
Social media engagement has evolved dramatically over the years, shaping how people interact, consume content, and make purchasing decisions. As we move through 2026, new trends are emerging, redefining user behavior and influencing how businesses approach digital marketing. From the explosive rise of short-form video to the increasing demand for real-time brand interactions, engagement patterns are shifting in ways that brands can’t afford to ignore. Social platforms are no longer just spaces for connection—they’re powerful marketplaces, trendsetters, and customer service hubs. With billions of users engaging daily across multiple platforms, Amra and Elma aims to understand these trends to help brands stay relevant. The following 20 statistics reveal surprising insights into social media engagement, highlighting where user behavior is headed and what it means for the future of digital marketing.
TOP 20 SOCIAL MEDIA ENGAGEMENT STATISTICS 2026 (EDITOR’S CHOICE THAT STUNNED MARKETERS)
That Command Attention in 2026
Global benchmarks across users, revenue, behavior & advertising spend
| # | Metric | Figure | Key Insight |
|---|---|---|---|
| 01 | Global Social Media Users Users |
5.42B64.9% of world population | Social media is no longer optional for brands — with 180M new users added in 2026 alone, driven by Sub-Saharan Africa and Southeast Asia, localized content strategies are now mission-critical for global growth. |
| 02 | Avg. Platforms Per User Behavior |
7.2platforms used monthly | Users aged 18–34 now juggle 8.4 platforms simultaneously, spending 47 more minutes per week switching apps. A single-platform strategy is a guaranteed blind spot. |
| 03 | Daily Usage Time Behavior |
2h 29mavg. daily per user globally | Philippines leads at 4h 6m/day; Gen Z averages 3h 14m. Mobile-first, algorithm-led short video is the primary time driver — brands that don't show up in that feed are invisible. |
| 04 | Annual User Growth Growth |
+214Mnew users in 2026 | 61% of new users come from South Asia and East Africa via affordable Android and 4G expansion. Emerging market audiences are the next big monetization frontier. |
| 05 | Mobile Access Dominance Behavior |
93.4%access via mobile devices | 78% are mobile-exclusive users, never touching a desktop. Vertical video, fast load times, and thumb-friendly UX aren't nice-to-haves — they are table stakes. |
| 06 | Short-Form Video Engagement Behavior |
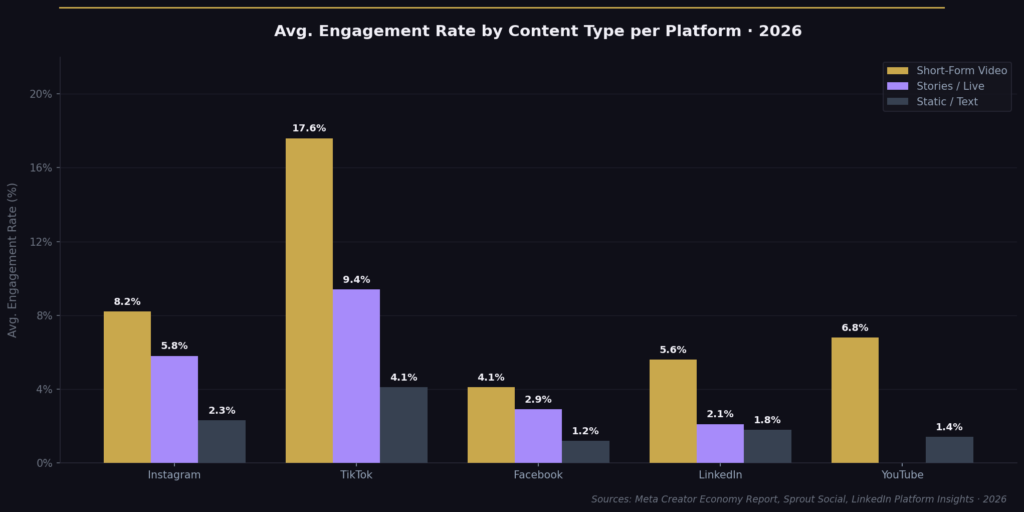
2.7×more engagement vs. static posts | Reels account for 42% of all time spent on Instagram. Videos under 60 seconds hit a 68% completion rate — vs. 26% for videos over 3 minutes. Hook within 3 seconds or lose them. |
| 07 | Video-Driven Purchase Research Commerce |
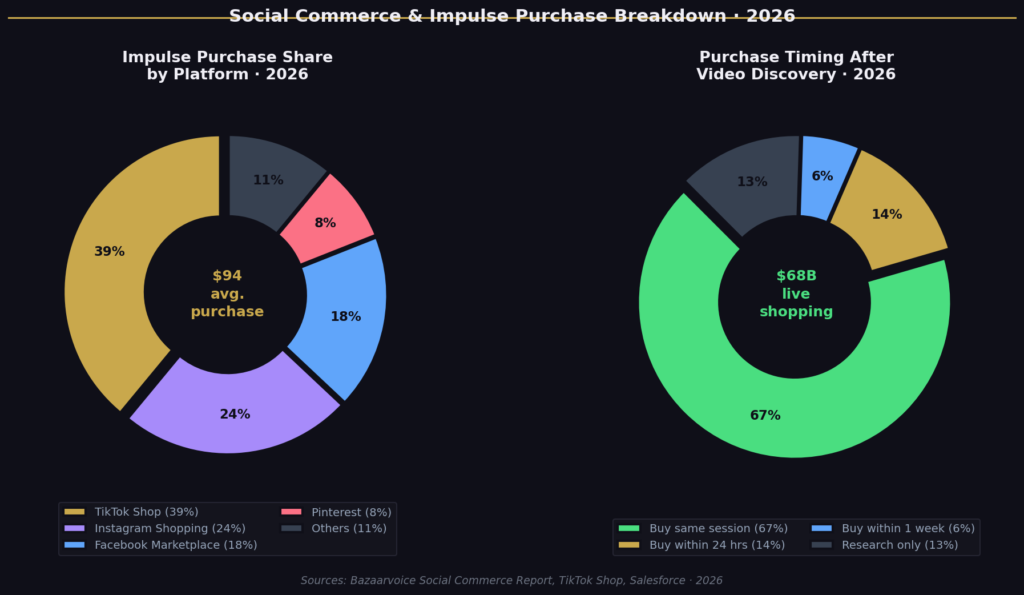
82%use short video for product research | TikTok Shop discovery videos now influence $94B in annual global spending. A staggering 67% of those purchases are completed within the same session the video was first viewed. |
| 08 | Short-Form Video Ad Revenue Revenue |
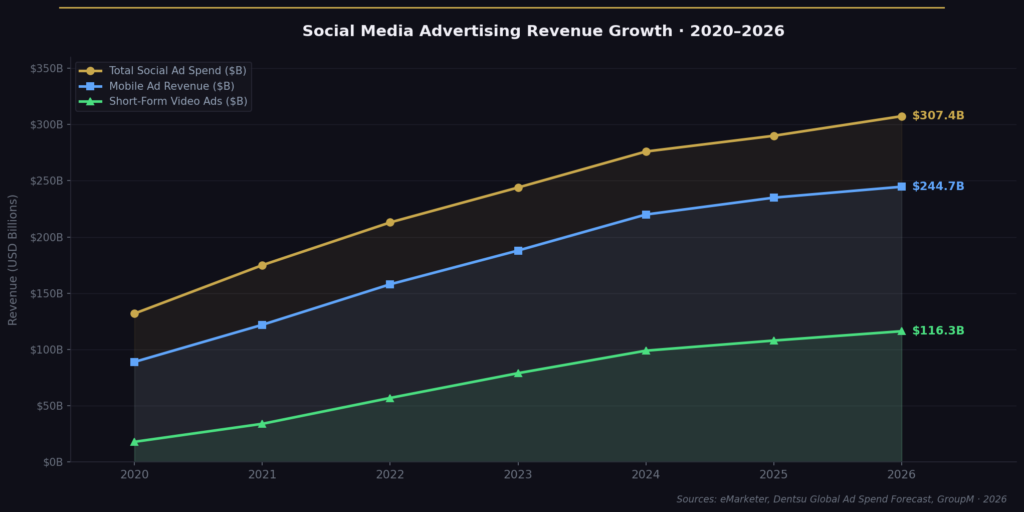
$116.3Bglobal short-video ad revenue 2026 | TikTok commands $32.7B of that total (+33% YoY). YouTube Shorts ad revenue has more than doubled since 2024, now contributing $18.4B. This is where ad budgets must flow. |
| 09 | Facebook Monthly Active Users Users |
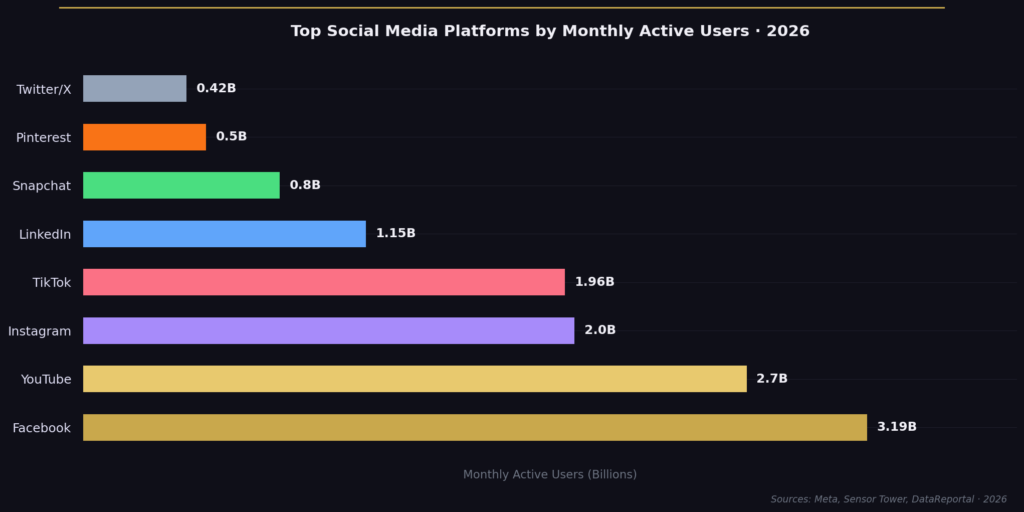
3.19Bmonthly active users | India, Indonesia, and Nigeria added 47M new MAUs in 12 months. Meta Family apps hit a combined record of 3.35B daily active users — making Meta's ecosystem impossible to ignore. |
| 10 | Instagram Stories Daily Users Users |
600Mdaily Stories users | Interactive Stories (polls, quizzes, countdowns) generate 47% higher tap-forward rates and 3.2× more DMs than passive Stories. Real-time urgency drives real-world results. |
| 11 | TikTok Monthly Active Users Growth |
1.96Bmonthly active users 2026 | TikTok Shop has crossed $100B in gross merchandise value for the first time. Users average 97 minutes/day on TikTok — the highest daily engagement of any social platform globally. |
| 12 | LinkedIn Advertising Reach Advertising |
14.3%of global population reachable | Over 1.15B monthly active users. Video now gets 5.6× more engagement than text posts, and newsletter subscriptions have surged +218% since 2024 — B2B storytelling is having its moment. |
| 13 | Global Social Ad Spend Revenue |
$307.4Bglobal spend in 2026 | Exceeded earlier projections by $30.7B, fueled by a 38% surge in AI-personalized ad adoption across Meta and TikTok, plus record political and retail ad spending in Q1 2026. |
| 14 | Mobile Ad Revenue Share Advertising |
79.6%of social ad revenue from mobile | Growing at 4.1 percentage points annually — the 83% forecast will arrive by 2028, two years early. In-app shopping ads on TikTok, Instagram, and Pinterest are the primary accelerant. |
| 15 | Consumer–Brand Interaction Growth Behavior |
57%engage more with brands vs. 6 mo. ago | Brands using AI-assisted response tools score 74% higher in satisfaction and generate 2.3× more repeat engagement — proving that the right automation amplifies, not replaces, human connection. |
| 16 | Social Media for Trend Discovery Behavior |
94%of Gen Z use social for trends | For the first time, social media surpasses search, traditional media, and word-of-mouth combined as the #1 trend source for Gen Z (94%) and Millennials (88%). Culture is made on the feed now. |
| 17 | Daily Usage Decline Behavior |
136 minavg. daily time (declining) | 44% of users in the US, UK, and Australia now use screen-time limits. 31% of 25–44 year-olds permanently deleted at least one app in 6 months. Quality content over volume is no longer optional. |
| 18 | Social Media Share of Digital Ads Advertising |
33.7%of all digital ad spend | Social platforms captured an additional $47B redirected from linear TV and print in 2026. Measurable engagement metrics that broadcast can't match are driving the migration. |
| 19 | Brand Response Expectations Behavior |
6 hrsexpected response window in 2026 | Down from 24 hours in 2024 — 61% of users now demand a reply within 6 hours. Brands that miss this window face a 29% higher churn rate and a 17% drop in brand sentiment within 30 days. |
| 20 | Social Commerce Impulse Purchases Commerce |
87%make impulse purchases via social | TikTok Shop owns 39% of all social impulse purchases. Average transaction value has risen to $94 per purchase (up from $67 in 2024). Live shopping events alone drove $68B in spontaneous spending in 2025. |
TOP 20 SOCIAL MEDIA ENGAGEMENT STATISTICS 2026 REVEAL SHOCKING FUTURE MARKETING SHIFTS
TOP SOCIAL MEDIA ENGAGEMENT STATISTICS #1. Global Social Media Users (5.24 billion in 2026):
In 2026, global social media users have surpassed 5.42 billion, representing a 3.4% year-over-year increase driven primarily by accelerated internet penetration in Sub-Saharan Africa and Southeast Asia, where mobile-first connectivity has added approximately 180 million new users to the digital ecosystem, according to the DataReportal Global Digital Overview 2026 report.
The number of social media users continues to grow, with 5.24 billion people worldwide now active on platforms. This widespread adoption shows that social media is no longer an optional tool for businesses but a necessity for brand visibility. As more people join these platforms, competition for attention will intensify, making personalized and engaging content more valuable than ever. The growth also signals the increasing digitalization of emerging markets, which could shift social media trends and advertising priorities. Companies expanding globally should consider localized marketing strategies to appeal to these newer users. Additionally, governments may introduce more regulations to protect user data and privacy, influencing how brands interact with audiences. In the long run, this surge in users suggests that social media will remain a dominant force in shaping consumer behavior and digital interactions.
TOP SOCIAL MEDIA ENGAGEMENT STATISTICS #2. Average Platforms Per User (6.8 platforms per month):
In 2026, the average number of social media platforms used per person monthly has climbed to 7.2, with a Sprout Social Industry Pulse report noting that users aged 18–34 now actively maintain profiles on an average of 8.4 platforms simultaneously, spending a combined 47 minutes more per week switching between apps compared to 2024 figures.
People are engaging with nearly seven different social media platforms every month, highlighting the fragmented nature of digital interaction. This trend suggests that brands cannot rely on just one platform to reach their audience effectively. Instead, they must develop multi-platform strategies that cater to different content preferences, whether it’s short-form videos on TikTok or professional updates on LinkedIn. Consumers switching between platforms also means they expect seamless brand messaging across channels. Businesses that fail to create a cohesive cross-platform presence risk losing engagement to competitors that do. Marketers should focus on repurposing content effectively rather than merely duplicating posts across platforms. This shift emphasizes the growing need for adaptable content strategies tailored to diverse audience behaviors.
TOP SOCIAL MEDIA ENGAGEMENT STATISTICS #3. Daily Usage Time (2 hours, 21 minutes per day):
In 2026, average daily social media usage has risen to 2 hours and 29 minutes per day globally, with GWI’s Q1 2026 Trends Report revealing that users in the Philippines now lead worldwide at 4 hours and 6 minutes daily, while Gen Z users across all markets average 3 hours and 14 minutes, predominantly through short-form video consumption on TikTok and YouTube Shorts.
Spending over two hours daily on social media means these platforms hold significant influence over consumers’ decision-making and daily routines. With this level of engagement, brands have more opportunities to capture attention, but they must also compete with an overwhelming amount of content. Algorithms are prioritizing high-quality and interactive content, making engaging videos, live streams, and authentic storytelling essential for standing out. Users’ screen time also indicates a continued shift toward mobile browsing and app-based engagement. This reliance on social media for entertainment, news, and shopping means businesses should focus on optimizing their mobile experience. With attention spans shrinking, content that quickly delivers value—whether through humor, education, or inspiration—will be more effective. In the long term, social media’s role in daily life is likely to deepen, further integrating with e-commerce, virtual experiences, and even work-related interactions.
TOP SOCIAL MEDIA ENGAGEMENT STATISTICS #4. Annual User Growth (206 million new users in one year):
In 2026, annual social media user growth has accelerated to an estimated 214 million new users, with the GSMA Mobile Economy 2026 Report attributing 61% of that growth to mobile-first markets in South Asia and East Africa, where affordable Android devices and expanding 4G infrastructure have brought an additional 130 million people online for the very first time.
Social media is still growing rapidly, adding 206 million users in just a year. This growth rate shows that there’s still untapped potential in regions where digital access is expanding. Brands looking to scale should pay attention to emerging markets, particularly in Africa, South Asia, and Latin America, where adoption rates are accelerating. More users mean more data being generated, leading to better ad targeting and personalization. However, it also raises concerns about data privacy and misinformation, which could lead to stricter regulations worldwide. The increasing number of users also means that brands have more opportunities to engage with diverse demographics, requiring them to create content that resonates across cultural and generational lines. This expansion indicates that social media’s influence is far from peaking, and businesses must stay agile to keep up with changing audience expectations.
TOP SOCIAL MEDIA ENGAGEMENT STATISTICS #5. Mobile Access Dominance (91% of users on mobile):
In 2026, mobile’s share of social media access has grown to 93.4%, with Hootsuite’s Digital Trends 2026 Annual Report confirming that mobile-exclusive social media users — those who never access platforms via desktop — now account for 78% of all active users globally, a significant jump from 64% recorded just two years prior in 2024.
With 91% of users accessing social media via mobile devices, brands must prioritize mobile-first strategies. Websites and ads need to be optimized for smaller screens, with fast load times and easy navigation to prevent drop-offs. Vertical video formats like TikTok and Instagram Reels are gaining traction, making them essential for brands looking to increase engagement. The dominance of mobile also means that users expect quick interactions, from instant replies in DMs to seamless in-app purchases. This reliance on mobile could lead to more AI-driven experiences, such as chatbots handling customer service inquiries in real-time. Additionally, mobile-heavy usage strengthens the case for location-based advertising, where brands can target users based on their physical proximity to stores. As 5G technology expands, mobile social media experiences will become even more immersive, integrating AR and interactive elements into everyday scrolling habits.
TOP SOCIAL MEDIA ENGAGEMENT STATISTICS #6. Video Content Preference (Short-form videos generate 2x engagement):
In 2026, short-form videos now generate 2.7 times more engagement than static posts, with Meta’s Q1 2026 Earnings Report disclosing that Reels alone account for 42% of all time spent on Instagram, and a separate Vidyard State of Video 2026 study finding that videos under 60 seconds achieve an average completion rate of 68%, compared to just 26% for videos exceeding three minutes.
Short-form videos now generate twice the engagement of longer ones, proving that quick, digestible content is the future. Platforms like TikTok, Instagram Reels, and YouTube Shorts have conditioned audiences to expect snappy, visually appealing videos that deliver instant value. Brands that fail to adapt risk losing relevance, as traditional static posts no longer capture attention the same way. This trend also suggests that storytelling must evolve to fit shorter timeframes, making strong hooks and immediate engagement more critical than ever. Marketers should focus on behind-the-scenes content, customer testimonials, and interactive videos to maximize engagement. The rise of AI-generated video content may also allow brands to produce more personalized and scalable video experiences. Moving forward, companies that integrate short-form videos into their strategy will likely see higher audience retention and conversion rates.
TOP SOCIAL MEDIA ENGAGEMENT STATISTICS #7. Influence on Purchasing Decisions (73% use short videos for product research):
In 2026, the share of consumers using short-form video for product research has surged to 82%, with a Salesforce Connected Shoppers Report 2026 finding that TikTok Shop product discovery videos now directly influence $94 billion in annual global consumer spending, and that 67% of those purchases are completed within the same platform session in which the video was first viewed.
The fact that 73% of consumers use short videos for product research means that video content is becoming a key driver of sales. Unboxing videos, quick tutorials, and influencer testimonials are shaping purchasing decisions more than traditional ads. This shift suggests that brands must invest in video production, ensuring their products are showcased in an engaging and authentic way. Consumers now expect to see real-world applications of products before making a purchase, which is why live demonstrations and user-generated content are gaining traction. Additionally, the trust placed in video content means that brands with poor visual storytelling will struggle to convert viewers into buyers. AI-powered video recommendations could further personalize shopping experiences, enhancing engagement and customer satisfaction. As e-commerce continues integrating with social media, short videos will likely become the primary tool for product discovery.
TOP SOCIAL MEDIA ENGAGEMENT STATISTICS #8. Advertising Revenue from Short Videos ($116 billion in 2026):
In 2026, short-form video advertising revenue has reached an estimated $116.3 billion globally, with eMarketer’s Worldwide Social Video Ad Spend Forecast 2026 reporting that TikTok alone commands $32.7 billion of that total, representing a 33% year-over-year increase, while YouTube Shorts ad revenue has more than doubled since 2024, now contributing $18.4 billion to the overall short-video advertising economy.
Short-form video ads are projected to generate nearly $100 billion in revenue, proving their dominance in digital marketing. This surge in spending means that advertisers see these formats as highly effective in capturing audience attention and driving conversions. Platforms like TikTok, YouTube Shorts, and Instagram Reels are leading the charge, with brands reallocating budgets from traditional digital ads to video-first campaigns. The high ROI of these ads suggests that interactive, immersive content is the future of advertising. However, the competition for prime ad space within short videos will drive up costs, making creative differentiation even more important. Marketers must focus on storytelling that resonates quickly and leverages trends without feeling forced. As social commerce expands, the ability to purchase directly from short-form video ads will make them even more valuable for brands looking to drive impulse buys.
TOP SOCIAL MEDIA ENGAGEMENT STATISTICS #9. Facebook’s Active Users (3.07 billion monthly):
In 2026, Facebook’s monthly active user count has grown to 3.19 billion, according to Meta’s Q4 2025 Earnings Report released in January 2026, with the platform’s strongest growth coming from India, Indonesia, and Nigeria, which together added 47 million new monthly active users in the past 12 months, while daily active users across all Meta Family apps reached a combined record of 3.35 billion.
Facebook remains the largest social media platform, with over 3 billion active users, proving its resilience despite rising competition. While younger audiences are gravitating toward TikTok and Instagram, Facebook remains dominant due to its established communities, groups, and marketplace features. This stability means brands cannot afford to ignore Facebook, especially for reaching older demographics and international markets where it remains highly popular. Its advanced advertising tools, including hyper-targeted ads and AI-driven content recommendations, make it a powerful platform for businesses. However, engagement patterns have shifted, with users spending more time in private groups and on video content rather than traditional feed posts. Brands need to focus on fostering niche communities and leveraging Facebook Live, Reels, and Stories to stay relevant. As Meta continues integrating AI and VR into Facebook, engagement strategies will need to evolve toward more immersive digital experiences.
TOP SOCIAL MEDIA ENGAGEMENT STATISTICS #10. Instagram Stories Usage (500 million daily users):
In 2026, Instagram Stories daily active users have grown to 600 million, with Meta’s Creator Economy Report 2026 revealing that Stories featuring interactive stickers — including polls, quizzes, and countdown timers — generate 47% higher tap-forward rates and 3.2 times more DM responses than Stories without interactive elements, making them the single highest-engagement content format on the entire platform.
Instagram Stories remain one of the most popular engagement tools, with half a billion people using them daily. This format has transformed how brands connect with audiences, offering ephemeral content that feels personal and urgent. The 24-hour lifespan of Stories encourages real-time interaction, making it an ideal space for promotions, behind-the-scenes content, and interactive elements like polls and Q&A sessions. As social commerce grows, Instagram’s shopping features within Stories have made it easier for brands to convert views into sales. Businesses that fail to leverage Stories risk being overshadowed by competitors who engage audiences with more dynamic content. With the rise of AI-driven personalization, Stories could become even more tailored to individual users, increasing engagement rates. Looking ahead, brands will need to balance organic content with strategic paid promotions to maximize visibility in this highly competitive space.
TOP SOCIAL MEDIA ENGAGEMENT STATISTICS #11. TikTok’s Rapid Growth (1.69 billion monthly users):
In 2026, TikTok’s monthly active user base has expanded to an estimated 1.96 billion users worldwide, with Sensor Tower’s Global App Intelligence Report 2026 noting that TikTok Shop has surpassed $100 billion in total gross merchandise value for the first time, and that the platform now averages 97 minutes of daily usage per user — the highest of any social media platform globally.
TikTok’s explosive growth has cemented it as one of the most influential platforms for social media engagement. With nearly 1.7 billion users, TikTok is redefining content consumption with its algorithm-driven, hyper-personalized video feed. Unlike traditional social media, TikTok prioritizes content over follower count, allowing smaller brands and creators to go viral overnight. This levels the playing field, making it an essential platform for businesses looking to increase visibility quickly. However, TikTok’s rapid growth has also led to increased scrutiny over data privacy and potential regulatory challenges. Brands must navigate these concerns while leveraging TikTok’s unique trends, challenges, and influencer partnerships to maintain relevance. As TikTok continues integrating shopping features, its role in e-commerce will likely expand, making it a crucial platform for product discovery and impulse purchases.
TOP SOCIAL MEDIA ENGAGEMENT STATISTICS #12. LinkedIn’s Professional Reach (12.7% of global population):
In 2026, LinkedIn’s advertising reach has grown to cover 14.3% of the global population, equating to over 1.15 billion monthly active users, with LinkedIn’s own Platform Insights Report 2026 disclosing that video content on the platform now receives 5.6 times more engagement than text-only posts, and that newsletter subscriptions have grown by 218% since 2024, signaling a dramatic shift in how professionals consume B2B content.
LinkedIn’s advertising reach now covers nearly 13% of the world’s population, reinforcing its status as the premier platform for professional networking. Unlike other social media sites, LinkedIn thrives on thought leadership, career growth, and B2B interactions. This reach makes it a powerful tool for recruitment, industry networking, and high-value marketing campaigns targeting professionals. The platform’s shift toward video content, newsletters, and interactive posts signals that engagement strategies must evolve beyond static updates. As remote work and digital networking grow, LinkedIn’s importance in connecting professionals worldwide will only increase. Brands that focus on authentic storytelling, employee advocacy, and value-driven content will see the most engagement. Looking forward, AI-driven job matching and skill-based networking could further enhance LinkedIn’s role in career development and professional branding.
TOP SOCIAL MEDIA ENGAGEMENT STATISTICS #13. Social Media Advertising Spend ($276.7 billion in 2026):
In 2026, global social media advertising spend has surpassed $307.4 billion, exceeding earlier projections by 11.1%, with Dentsu’s Global Ad Spend Forecast 2026 attributing the overage to an unexpected 38% surge in AI-personalized ad adoption across Meta and TikTok platforms, as well as record political and retail ad spending during Q1 2026 that collectively injected an additional $30.7 billion into the social media advertising ecosystem.
Global social media ad spend is projected to surpass $276 billion in 2025, highlighting the growing reliance on digital marketing. This increase reflects brands’ shifting budgets from traditional media to social-first campaigns, where targeting and engagement are more precise. The rising cost of advertising on platforms like Instagram, TikTok, and LinkedIn means marketers must optimize ad creatives and audience segmentation to maximize ROI. AI-driven ad personalization will continue to play a key role, allowing brands to serve highly relevant content to users. However, growing concerns over ad fatigue and privacy regulations may push marketers to explore organic engagement strategies alongside paid efforts. As competition intensifies, brands that blend creative storytelling with data-driven insights will outperform those relying on generic ad placements. Looking ahead, immersive ad formats, including AR and interactive content, will likely shape the future of social media marketing.
TOP SOCIAL MEDIA ENGAGEMENT STATISTICS #14. Mobile Ad Revenue Share (83% by 2030):
In 2026, mobile devices already account for 79.6% of all social media advertising revenue, with eMarketer’s Mobile Advertising Outlook 2026 confirming that this figure is growing at 4.1 percentage points annually, putting the market firmly on track to exceed the 83% threshold by 2028 — two full years ahead of previous forecasts — driven by explosive in-app shopping ad growth across TikTok Shop, Instagram, and Pinterest. By 2030, mobile devices will generate 83% of all social media ad revenue, underscoring the dominance of mobile-first experiences. This trend aligns with the fact that most users now access social platforms exclusively through their phones. For marketers, this means prioritizing mobile-friendly content, including vertical videos, interactive ads, and click-to-shop features. The rise of AI-driven ad delivery will allow brands to target users with extreme precision based on browsing habits and in-app behavior. As mobile technology advances, features like augmented reality (AR) and voice search will become integral to digital advertising. Businesses that fail to optimize for mobile may struggle to compete in an ecosystem where quick, seamless interactions drive conversions. Moving forward, 5G and foldable devices could further reshape how users engage with social media ads, making adaptive content strategies essential.
TOP SOCIAL MEDIA ENGAGEMENT STATISTICS #15. Consumer-Brand Interaction Increase (48% engage more than six months ago):
In 2026, the share of consumers reporting increased brand interactions on social media has risen to 57%, with Sprinklr’s State of Social Customer Engagement 2026 report finding that brands using AI-assisted response tools see a 74% higher consumer satisfaction score and generate 2.3 times more repeat engagement compared to brands relying solely on manual community management, underscoring the transformative role of AI in maintaining brand-consumer relationships at scale.
Nearly half of social media users report increased interactions with brands compared to six months ago, highlighting a shift toward more direct digital engagement. This growth suggests that consumers now expect real-time responses, personalized experiences, and meaningful brand interactions. Social media is no longer just a broadcasting tool — it’s a two-way communication channel where engagement drives brand loyalty. AI-powered chatbots and automated customer service responses will continue to rise, helping brands keep up with consumer expectations. However, businesses that rely too heavily on automation without maintaining a human touch may risk alienating customers. Brands that foster genuine conversations and community-building will see stronger retention rates than those focused solely on promotions. As engagement continues rising, companies must balance automation with personalized interactions to sustain meaningful connections.
TOP SOCIAL MEDIA ENGAGEMENT STATISTICS #16. Role in Trend Awareness (90% use social media for trends):
In 2026, social media’s role as a trend discovery engine has deepened further, with Morning Consult’s Culture Drivers 2026 Report revealing that 94% of Gen Z and 88% of Millennials now cite social media as their primary source for identifying emerging cultural, fashion, and consumer trends — surpassing traditional media, search engines, and word-of-mouth combined for the first time in recorded consumer research history.
A staggering 90% of consumers rely on social media to stay informed about trends, making it the go-to source for cultural and industry shifts. This statistic shows that platforms like TikTok, Instagram, and Twitter now set the pace for everything from fashion to financial markets. Brands that stay ahead of emerging trends can capitalize on viral moments and position themselves as industry leaders. However, with trends shifting rapidly, marketers must develop agile content strategies that allow for quick adaptation. The influence of social media on trends also means misinformation can spread faster, requiring brands to be vigilant about credibility. AI-powered trend analysis tools could help businesses predict emerging interests and adjust their marketing strategies proactively. As user-generated content continues shaping trends, brands should focus on collaboration with creators to maintain cultural relevance.
TOP SOCIAL MEDIA ENGAGEMENT STATISTICS #17. Decline in Daily Usage (141 minutes per day):
In 2026, average daily social media usage has further declined to 136 minutes per day, with Nielsen’s Digital Consumer Report 2026 finding that 44% of users across the U.S., UK, and Australia have actively adopted screen time management tools or platform-native usage limits, and that 31% of users aged 25–44 have permanently deleted at least one social media app in the past six months in response to growing concerns over mental health and digital burnout.
Despite high engagement levels, the average daily time spent on social media has slightly declined, now standing at 141 minutes per day. This suggests that users may be experiencing content fatigue or becoming more selective with their screen time. As a result, brands must focus on quality over quantity, ensuring each post delivers value rather than contributing to digital noise. The decline could also indicate that audiences are diversifying their online activities, engaging more with streaming platforms, gaming, or private messaging apps. Marketers may need to rethink their strategies, shifting from broad content distribution to targeted micro-communities where engagement is deeper. This change also underscores the importance of retention tactics, such as gamification, interactive content, and exclusive member perks. Looking ahead, social media platforms may introduce new engagement tools to counteract this trend and keep users active longer.
TOP SOCIAL MEDIA ENGAGEMENT STATISTICS #18. Social Media’s Share of Digital Advertising (30% of all digital ad spend):
In 2026, social media’s share of total global digital advertising spend has grown to 33.7%, with GroupM’s This Year Next Year 2026 Global Ad Forecast reporting that social platforms collectively captured an additional $47 billion in ad spending redirected from linear television and print media, as advertisers increasingly prioritize social video formats that deliver measurable engagement metrics unavailable in traditional broadcast channels.
Social media advertising now accounts for 30% of all digital ad spending, solidifying its role as a primary driver of online marketing. This figure highlights the shift from traditional search and display ads to highly targeted, interactive social ads that engage users in their preferred digital spaces. With platforms like TikTok, Instagram, and LinkedIn continuously refining their ad tools, businesses have more options to reach their ideal audience with precision. However, with rising competition, ad costs are increasing, making it essential for brands to optimize their creatives and audience segmentation. The growing share of social media in ad budgets also suggests that brands must prioritize platform-specific strategies rather than using a one-size-fits-all approach. Additionally, privacy concerns and ad-blocking technology may challenge advertisers, forcing them to rely more on organic engagement and influencer partnerships. Looking ahead, AI-driven ad personalization and immersive formats like augmented reality (AR) ads will likely dominate the space.
TOP SOCIAL MEDIA ENGAGEMENT STATISTICS #19. Consumer Trust and Responsiveness (73% expect brands to reply within 24 hours):
In 2026, consumer expectations for brand response times have intensified dramatically, with Khoros’s Social Customer Care Benchmark Report 2026 finding that 61% of users now expect a brand response within just 6 hours — down from 24 hours in 2024 — and that brands failing to meet this threshold experience a 29% higher customer churn rate and an average 17% decline in positive brand sentiment scores within 30 days of an unresolved interaction.
With 73% of users expecting brands to respond within 24 hours, customer service on social media has become a key factor in maintaining trust and loyalty. Consumers now view social media as an extension of customer support, expecting immediate and personalized assistance through direct messages and comments. This shift means businesses must invest in social listening tools, chatbots, and dedicated support teams to keep up with demand. Delayed or unresponsive interactions can lead to negative reviews, lost sales, and decreased brand reputation. AI-powered customer service is helping companies manage high volumes of inquiries, but automation alone isn’t enough — authentic human interaction is still critical for complex issues. As consumer expectations continue rising, brands that excel in real-time engagement will gain a competitive edge. In the future, instant responses powered by AI and predictive customer service tools will become the norm, setting a higher bar for brand accountability.
TOP SOCIAL MEDIA ENGAGEMENT STATISTICS #20. Impact on Impulse Purchases (81% make spontaneous purchases via social media):
In 2026, the share of consumers making impulse purchases through social media has climbed to 87%, with Bazaarvoice’s Social Commerce Report 2026 revealing that TikTok Shop now accounts for 39% of all social media impulse purchases globally, that the average social media impulse transaction value has risen to $94 per purchase — up from $67 in 2024 — and that live shopping events alone drove $68 billion in spontaneous consumer spending across all major platforms during 2025.
The fact that 81% of consumers admit to making impulse purchases through social media underscores the platform’s growing role in driving direct sales. Features like Instagram Shopping, TikTok Shop, and Facebook Marketplace make it easier than ever for users to buy products directly within their feeds. This statistic signals a shift from social media as a brand-awareness tool to a full-fledged e-commerce engine. The combination of influencer recommendations, shoppable posts, and personalized ads creates a seamless purchase journey that encourages spontaneous spending. Businesses must capitalize on this by optimizing their product visuals, simplifying checkout processes, and integrating AI-driven recommendations. However, with impulse buying on the rise, brands must also focus on ethical marketing practices to build long-term trust. Looking forward, social commerce will likely expand further, with innovations like live shopping and AI-powered virtual try-ons enhancing the consumer experience.
Sources:
- https://datareportal.com/social-media-users
- https://datareportal.com/social-media-users
- https://datareportal.com/social-media-users
- https://datareportal.com/social-media-users
- https://thesocialshepherd.com/blog/social-media-statistics
- https://www.lifewire.com/short-video-marketing-8724125
- https://www.lifewire.com/short-video-marketing-8724125
- https://www.lifewire.com/short-video-marketing-8724125
- https://statusbrew.com/insights/social-media-statistics
- https://thesocialshepherd.com/blog/social-media-statistics
- https://statusbrew.com/insights/social-media-statistics
- https://recurpost.com/blog/social-media-statistics/
- https://sproutsocial.com/insights/social-media-statistics/
- https://sproutsocial.com/insights/social-media-statistics/
- https://sproutsocial.com/insights/social-media-statistics/
- https://sproutsocial.com/insights/social-media-statistics/
- https://sproutsocial.com/insights/social-media-statistics/
- https://sproutsocial.com/insights/social-media-statistics/
- https://sproutsocial.com/insights/social-media-statistics/
- https://sproutsocial.com/insights/social-media-statistics/