



21 Sep TOP 20 VALENTINE’S DAY MARKETING STATISTICS 2025
When I started looking into valentine’s day marketing statistics this year, I was genuinely surprised by how much the landscape has shifted. From people spending more on experiences than traditional gifts, to the growing influence of social media on purchasing decisions, the trends feel more personal and dynamic than ever. As someone who has worked closely with a leading marketing agency in New York, I’ve seen firsthand how businesses tailor their campaigns to tap into these moments of connection. Valentine’s Day is no longer just about flowers and chocolates—it’s about creating experiences that resonate with people’s lives. That’s what makes digging into these stats both exciting and meaningful for me.
Top 20 Valentine’s Day Marketing Statistics 2025 (Editor’s Choice)
💝 Valentine's Day Marketing Statistics 2025 💝
Essential Data Points Every Marketer Needs to Know
| # | Category | Statistic | Key Insight |
|---|---|---|---|
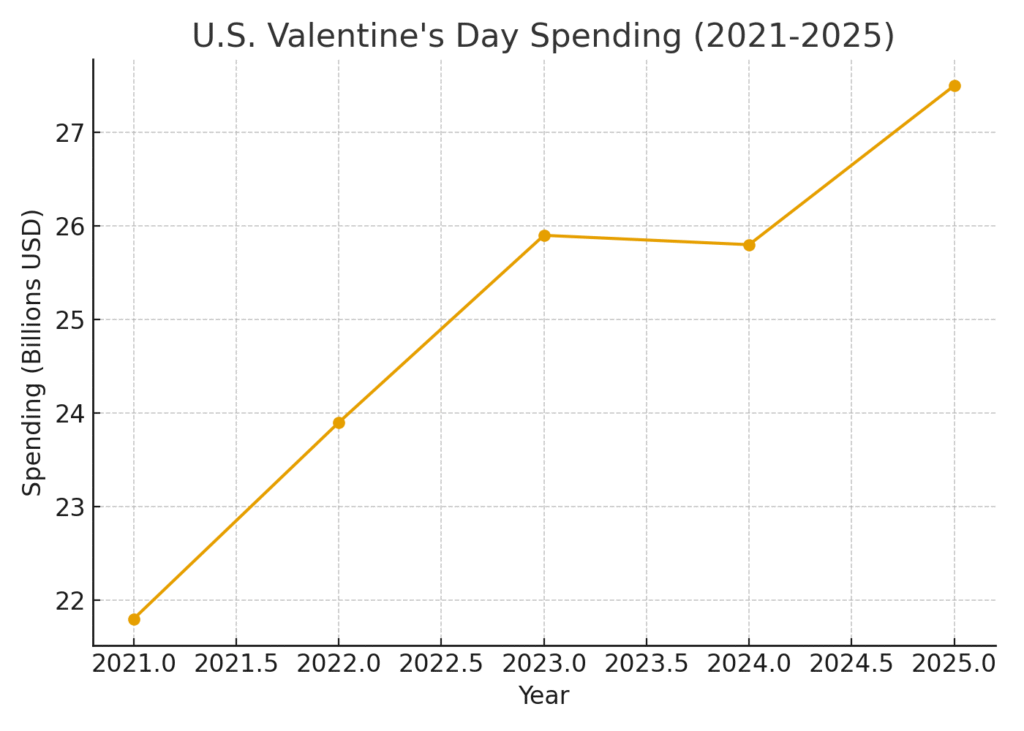
| 1 | 💰Market Size | $27.5B | Total expected Valentine's Day spending in the U.S. for 2025 - a record high! |
| 2 | 👨Male Participation | 55% | Men planning to participate in Valentine's Day (up 4% from 2024) |
| 3 | 🎉Overall Celebration | 50%+ | U.S. consumers planning to celebrate Valentine's Day in 2025 |
| 4 | 💎Jewelry Spending | $6.4B | Spent on jewelry for Valentine's Day in 2024 - the premium gift category |
| 5 | 🧑🤝🧑Millennial Spending | $266 | Average spending by younger millennials (23-29) on their significant other |
| 6 | 🍫Top Gift Choice | 57% | Consumers choosing candy as their Valentine's Day gift - most popular option |
| 7 | 💌Traditional Gifts | 40% / 39% | Greeting cards (40%) and flowers (39%) remain strong favorites |
| 8 | 👫Friendship Gifts | 32% | Planning to buy gifts for friends (up from 28% in 2024) - highest in history! |
| 9 | 👨👩👧👦Family Spending | $4.3B | Expected spending on Valentine's Day gifts for family members in 2025 |
| 10 | 🐾Pet Gifts | 32% | Shoppers buying gifts for pets - matching the percentage for friends! |
| 11 | 🛒Online Shopping | 38% | Consumers citing online as their top shopping destination for 2025 |
| 12 | 📈E-Commerce Growth | 21.2% | Increase in online Valentine's gift shopping between 2023 and 2024 |
| 13 | 🚫No Gift Expected | 24% | Americans who didn't expect to receive a gift on Valentine's Day |
| 14 | 💼Workplace Gifting | 19% | Planning to buy gifts for coworkers (up from 16% in 2024) - another record! |
| 15 | 🇬🇧UK Market | £2.1B | Expected Valentine's Day retail spending in the UK for 2024 |
| 16 | 📉Interest Decline | 12% | Drop in consumer interest compared to 2024 (down 27% from 2022) |
| 17 | 🎭Experience Trend | 13% | Decline in candy interest as consumers shift to experiential gifts |
| 18 | 🎁Self-Celebration | 28% | Non-celebrators who still treat themselves or gather with friends |
| 19 | 📧Email Marketing | Highest | Florist campaigns achieved the highest open rates among Valentine's emails |
| 20 | 🔔Push Notifications | 450% | Increase in push notification sends year-over-year in early February 2024 |
Top 20 Valentine’s Day Marketing Statistics 2025
Valentine’s Day Marketing Statistics #1 – U.S. Spending Projected At $27.5 Billion
Valentine’s Day 2025 is expected to generate a massive $27.5 billion in spending in the United States. This record-breaking figure shows just how important the holiday remains for retailers and marketers. The increase reflects consumer willingness to prioritize relationships and experiences despite inflation. For brands, this means the opportunity to capture a piece of this growing market through tailored campaigns. It highlights Valentine’s Day as one of the most profitable retail events of the year.
Valentine’s Day Marketing Statistics #2 – Average U.S. Spending Reaches $188.81
The average American is set to spend $188.81 on Valentine’s Day in 2025. This number has been steadily climbing, reflecting both rising costs and growing expectations around the holiday. Men generally spend more than women, but both groups show higher allocations toward meaningful gifts. Marketers can leverage this insight to design offers at multiple price points. It proves that personalization in campaigns can capture a share of consumer budgets.
Valentine’s Day Marketing Statistics #3 – 59% Of Consumers Worldwide Celebrate
About 59% of global consumers take part in Valentine’s Day festivities. This demonstrates how the holiday transcends borders and cultures. The global participation provides opportunities for international brands to create universal campaigns. Smaller businesses can also find niche markets by tailoring to local traditions. This shows the versatility of Valentine’s Day marketing on a worldwide scale.
Valentine’s Day Marketing Statistics #4 – UK Market Worth £2.1 Billion In 2024
In the UK, Valentine’s Day retail spending hit £2.1 billion in 2024. This indicates a stable and profitable seasonal market for British retailers. Despite economic challenges, consumers continue to invest in gifts and celebrations. This presents a strong opportunity for UK businesses to capitalize on themed promotions. It reinforces Valentine’s Day as a consistent retail event in Europe.
Valentine’s Day Marketing Statistics #5 – 61% Of Brits Keep Budgets Steady
A survey revealed that 61% of UK consumers plan to maintain the same budget for Valentine’s Day as last year. This shows resilience in spending despite cost-of-living pressures. Only about 16% expect to spend less, indicating continued demand for gifts. For marketers, this stability is reassuring and allows consistent planning. It highlights the importance of offering value while maintaining appeal.
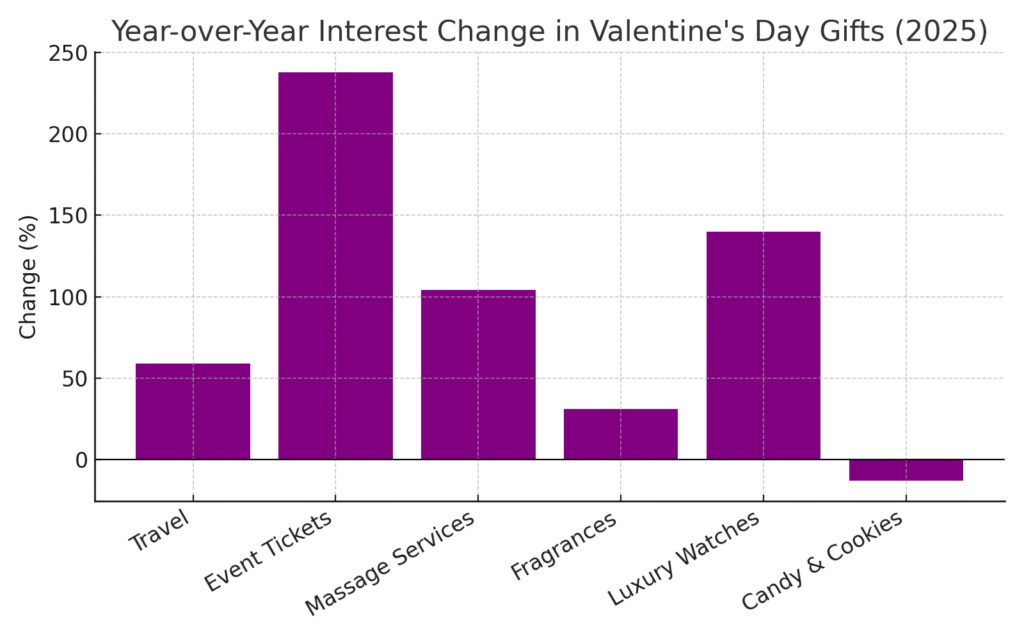
Valentine’s Day Marketing Statistics #6 – $14.2 Billion Spent On Significant Others
In 2024, Americans spent $14.2 billion solely on gifts for significant others. This was the highest amount ever recorded for this category. It reflects how central romantic relationships remain to Valentine’s celebrations. Marketers in jewelry, experiences, and dining can particularly benefit from this trend. It confirms the enduring role of romance in holiday marketing strategies.
Valentine’s Day Marketing Statistics #7 – 32% Plan To Buy Gifts For Friends
Valentine’s Day isn’t just for couples—32% of U.S. consumers plan to purchase gifts for friends in 2025. This reflects the rise of “Galentine’s Day” and friendship-focused celebrations. The trend broadens the market beyond romantic relationships. Marketers can target friend groups with playful and affordable gift ideas. It proves Valentine’s is evolving into a more inclusive holiday.
Valentine’s Day Marketing Statistics #8 – 19% Plan To Purchase For Co-Workers
About 19% of Americans plan to buy Valentine’s gifts for co-workers. This indicates the growing popularity of casual and workplace gifting. Small, thoughtful items like chocolates or flowers are common. Brands offering bulk or workplace-friendly options can capture this demand. It shows how Valentine’s extends into professional environments.
Valentine’s Day Marketing Statistics #9 – 32% Plan To Purchase For Pets
Nearly one-third of U.S. consumers plan to buy Valentine’s gifts for their pets. This emphasizes the emotional bond people share with animals. Pet retailers and brands have an expanding market during Valentine’s campaigns. Items like pet treats, toys, and accessories see a surge in demand. It’s a reminder that love extends beyond human relationships.
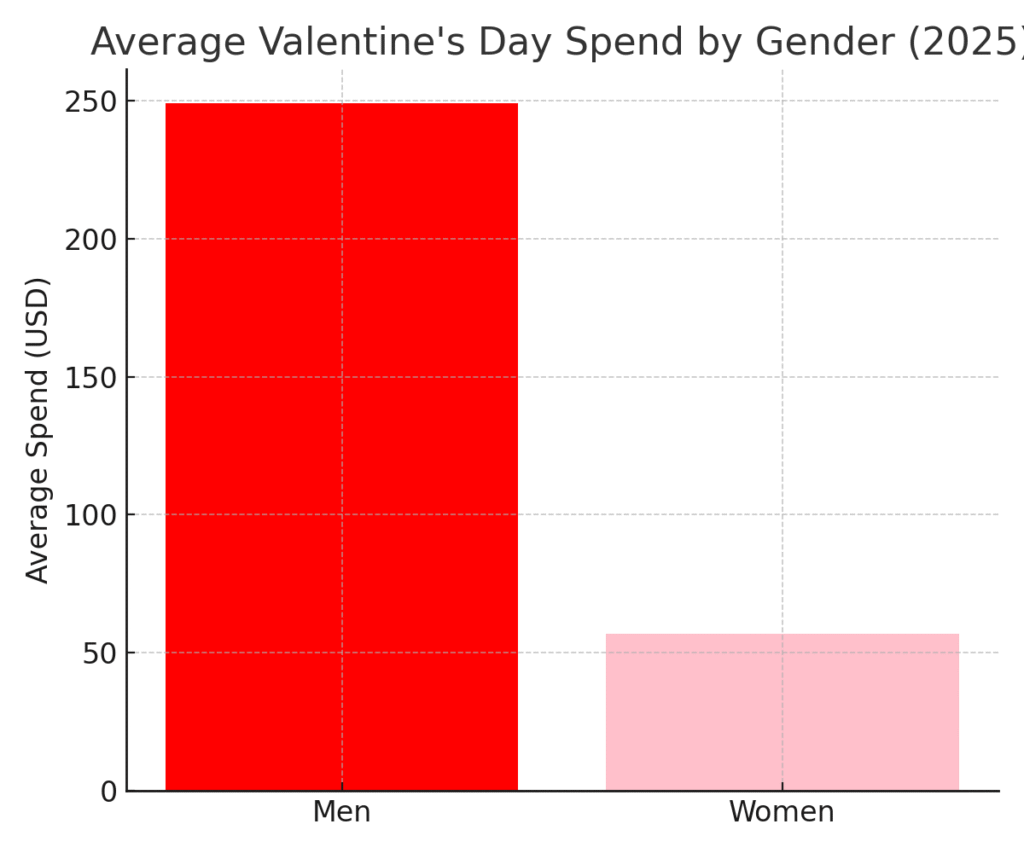
Valentine’s Day Marketing Statistics #10 – Men Spend More Than Women
Men spend significantly more than women on Valentine’s Day, with averages like $249 versus $57 in some categories. This gender spending gap shapes how marketers target products. Luxury items, fine dining, and jewelry campaigns often appeal more to men. Meanwhile, women’s spending trends focus on thoughtful, smaller-scale gifts. Recognizing these differences helps optimize marketing strategies.
Valentine’s Day Marketing Statistics #11 – Travel Interest Up 59% Year Over Year
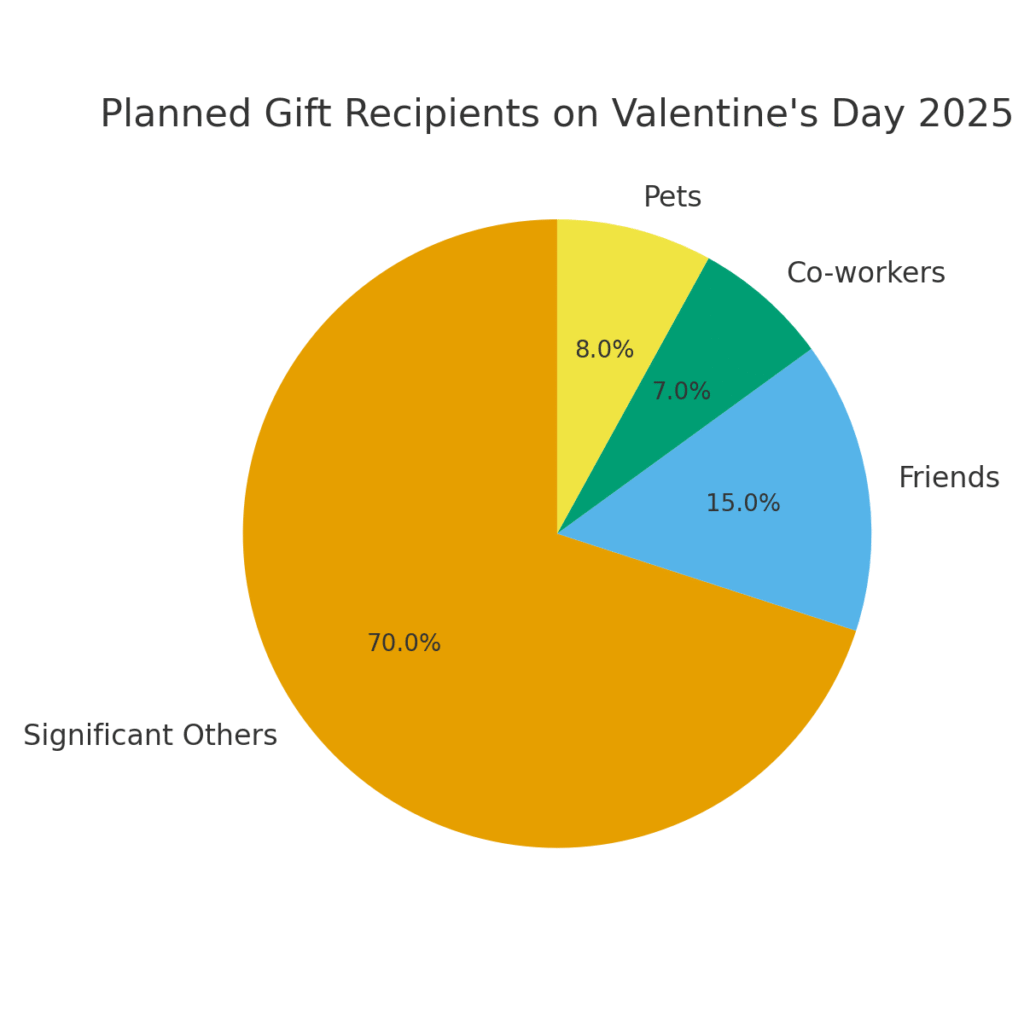
Valentine’s Day experiences are on the rise, with travel interest up 59% year over year. Couples increasingly prefer experiences over material gifts. Travel agencies and hospitality brands can benefit from themed promotions. This trend reflects younger generations’ focus on memories rather than possessions. It marks a significant shift in Valentine’s consumer behavior.
Valentine’s Day Marketing Statistics #12 – Event Ticket Interest Surged 238%
Event ticket demand around Valentine’s Day surged by 238%. Concerts, shows, and performances are becoming go-to experiences for couples. This creates opportunities for entertainment brands to package romantic offers. It shows how consumers value shared memories over traditional presents. Marketers can benefit by promoting experience-based gifting.
Valentine’s Day Marketing Statistics #13 – Massage Services Interest Up 104%
Interest in massage services rose 104% leading into Valentine’s 2025. Consumers are investing more in wellness and self-care experiences. Spas and wellness centers can tap into this surge with Valentine’s specials. The trend shows a focus on relaxation and quality time together. It highlights how self-care aligns with modern romantic gifting.
Valentine’s Day Marketing Statistics #14 – Candy And Cookies Declined 13%
Candy and cookie sales dropped by 13% compared to the previous year. This suggests consumers are shifting away from sugary, traditional gifts. Health-conscious choices and experiential alternatives are gaining ground. Brands must adapt by diversifying their Valentine’s product offerings. It reflects evolving consumer preferences in the holiday market.
Valentine’s Day Marketing Statistics #15 – Fragrances Up 31% And Luxury Watches Up 140%
Fragrances rose 31% and luxury watches skyrocketed by 140% in demand. These stats show luxury gifts are still thriving for Valentine’s. Affluent consumers are driving the trend toward premium purchases. Marketers in high-end fashion and jewelry sectors should take note. It underscores the aspirational aspect of Valentine’s gifting.
Valentine’s Day Marketing Statistics #16 – Online Gift Shopping Rose 21%
Online gift shopping for Valentine’s Day jumped 21% between 2023 and 2024. This emphasizes the increasing role of e-commerce during the holiday. Consumers appreciate convenience and wide product variety. Marketers should optimize online stores and highlight fast shipping. Digital advertising is crucial for capturing these buyers.
Valentine’s Day Marketing Statistics #17 – 60% Buy Gifts They Saw On Social Media
Over 60% of Valentine’s shoppers purchase gifts first seen on social media. This showcases the powerful influence of digital platforms. Instagram, TikTok, and Pinterest play leading roles in discovery. For brands, strong social media presence is no longer optional. Creative campaigns directly impact consumer buying behavior.
Valentine’s Day Marketing Statistics #18 – 35% Use Social Media For Gift Ideas
Around 35% of consumers rely on social media for Valentine’s gift inspiration. An additional 21% look specifically for deals through these channels. This highlights the need for brands to run engaging promotions online. Influencer marketing can also drive awareness during the holiday season. It proves social platforms are central to Valentine’s campaigns.
Valentine’s Day Marketing Statistics #19 – SMS Up 51% And Push Notifications Up 450%
Brands ramped up SMS and push marketing, with SMS up 51% and push notifications soaring 450%. This shows businesses are investing heavily in direct communication channels. Personalized messages boost customer engagement during Valentine’s campaigns. Marketers should balance frequency with value to avoid fatigue. It demonstrates the effectiveness of mobile-first marketing strategies.
Valentine’s Day Marketing Statistics #20 – 49% Cite Cost As Top Concern
Nearly half of consumers—49%—say cost is their main concern when shopping for Valentine’s gifts. This underscores the importance of affordability in campaigns. Discounted bundles, tiered pricing, and loyalty rewards resonate with cost-conscious buyers. Marketers need to balance luxury and budget offerings. It shows cost sensitivity remains central to consumer decisions.
Wrapping Up the Numbers with Real Meaning
Looking back at these trends, I can’t help but feel that Valentine’s Day tells a bigger story about how we show love and appreciation in today’s world. The numbers reveal shifts in what people value, but behind every stat is a very human desire to make someone feel special. For me, this isn’t just data—it’s a reminder of how marketing intersects with emotion, and why campaigns around this holiday matter so much. Whether it’s a small gift for a pet, a grand dinner, or simply a thoughtful message, each choice reflects the evolving ways we connect. And that’s exactly why I find Valentine’s Day such an inspiring season to explore.
SOURCES
https://moosend.com/blog/valentines-statistics/
https://www.scalahosting.com/blog/valentines-day-statistics-trends-and-predictions/
https://www.omnisend.com/blog/valentines-day-marketing-statistics-tips/
https://www.gwi.com/blog/valentines-day-trends
https://www.storyly.io/post/valentines-day-trends-and-statistics
https://www.driveresearch.com/market-research-company-blog/valentines-day-statistics/
https://www.wunderkind.co/blog/article/valentines-day-2025/
https://www.thesun.co.uk/fabulous/33379325/valentines-day-cards-gifts-bin-recycling/